
This week in our marketing statistics round-up, we compare display ad spend to digital video and mobile, consumers share their trust (or lack thereof) for advertising, and casino games hit the jackpot with mobile players.
Smartphones And Smart Devices
Amazon Echo and Google Home will account for 192 million of the four billion smart home devices in use by 2021, according to a new study by Ovum. The number of connected smart devices in use will nearly double from eight billion in 2016 to 15 billion in 2021, the company predicts. Smartphone adoption, however, is finally slowing . . . a lot.
In four years, annual growth of smartphones sold will have slowed from 30 percent in 2014 to only four percent.
Speaking of smartphones, US adults will spend two hours and 42 minutes each day consuming major media on smartphones by 2019, eMarketer predicts. The average daily time spent with major media for US adults will slightly exceed 12 hours this year, according to the company’s latest report “US Time Spent with Media: eMarketer’s Updated Estimates and Forecast for 2014-2019.”
Digital Up; Display Down
According to IAB’s fourth annual “Digital Content NewFronts: Video Ad Spend Study,” US marketers anticipate spending more than $9 million on their brand’s digital and mobile video advertising this year—67 percent more than 2015. The study polled 358 US agency and marketing professionals from a variety of industries. Eighty-eight percent said that they increased their original digital video budget as a result of attending the 2016 NewFronts. In addition, 77 percent agreed that the 2016 NewFronts encouraged them to investigate ways to incorporate VR or 360-degree video advertising into their marketing strategy.
Display ad spending isn’t enjoying the same growth however. Forrester predicts a potential decrease in display spending as high as $2.9 billion in 2018. The report explains this shift as a combination of ad ineffectiveness and the consumer’s ability to obtain what they want without interruptions, among others.
Trust And Transparency
Consumers love to hate ads, and a survey conducted by Choozle found that 41 percent of respondents rarely trust the ads they’re shown. In fact, 54 percent believe that less than half the ads they see are accurate. Half of the respondents reported having “negative” feelings toward mobile ads and 81 percent would rather be shown ads on their computer than their smartphone. Why the hate? Choozle’s survey identified the top three reasons people dislike online ads—they slow down web pages (28 percent), the same ad is shown multiple times regardless of someone’s interest (26 percent) and they take up too much space on a web page (22 percent).
Marketers rely on trustworthy data to serve relevant ads, and are demanding better transparency. A new survey by Metamarkets found that about 75 percent of marketers are concerned about the lack of data transparency in programmatic advertising. Nearly half of all brands (49 percent) said they can’t trust one-fifth or more of the data upon which they base media-buying decisions. Sixteen percent of all marketers (brands, agencies and publishers) participating in the survey distrusted at least 30 percent of their data and 41 percent said they wouldn’t significantly increase their programmatic budgets until there was better transparency.
Google Plays A Good Game
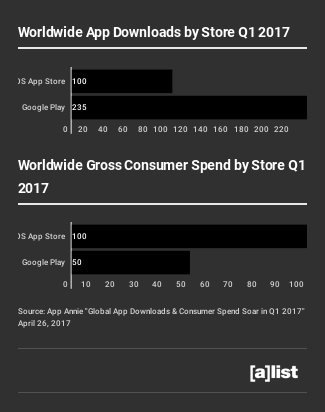
Google Play continued to lead in worldwide downloads over iOS in the first quarter, according to insights by App Annie. It saw both the greatest absolute growth and the fastest growth rate year over year out of the two stores, the site reported. Google Play grew 20 percent year over year, fueled largely by growth in emerging markets like India and Indonesia. Where iOS fell short on numbers, it certainly made up for in revenue—increasing its lead to 100 percent in consumer spend over Google Play in the first quarter.
Social Spend And Snapchat Exclusivity
Facebook’s revenue is up 51 percent, according to the company’s first quarter results. Total monthly active users were up 17 percent year-over-year reaching 1.94 billion, with advertising revenues hitting $7.9 billion—85 percent of which generated by ads.
While Facebook can boast big numbers, Snapchat still has something over the social media giant—exclusivity. App Annie recently measured behavior during Q4 of 2016 and found that on an average day, 35 percent of Snapchat’s daily users in the US aren’t reachable on Facebook that same day. Meanwhile, 46 percent who used Snapchat daily weren’t on Instagram and about 61 percent of Snapchat’s fans didn’t watch YouTube the same day.
Mobile Casinos And Virtual Race Tracks
Social casino games are finding a new home on mobile devices, according to insights provided by SuperData. Eighty-five percent of social casino gamers now play on smartphones, while PC has fallen to its lowest market share at 49 percent. Given the choice of one or the other, mobile is where it’s at, with 27 percent of gamers playing exclusively on a mobile device, and PC-only has dropped to six percent. An impressive 74 percent of smartphone users and 72 percent of tablet users play slots, SuperData reported.
It seems that Nintendo has a winner with Mario Kart 8 Deluxe for Nintendo Switch. With more than 459,000 combined packaged and digital sales in the US on launch day alone, Mario Kart 8 Deluxe is the fastest-selling game in the long-running Mario Kart series—a record previously held by Mario Kart Wii. Nintendo reports that solid sales numbers for Mario Kart 8 Deluxe equate to an attach rate of 45 percent, meaning that nearly one in two Nintendo Switch owners in the US purchased a copy of Mario Kart 8 Deluxe on the first day it was available.