
We’re seeing a dynamic shift of advertising spending, with more and more companies turning away from other formats and instead focusing more on mobile for better engagement with customers, according to eMarketer. However, when it comes to where all those dollars will be removed from to fund this mobile front, there are various places, per numbers reported in a July 2014 study by Advertiser Perceptions.
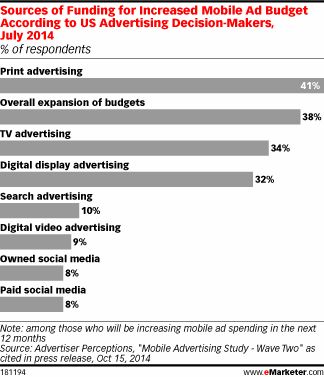
The main source, it seems, will come from print advertising, as 40 percent of advertising directors will take funds out of that to pick up its mobile ad spending over the next year. 34 percent of those polled intend to take funds out of its TV advertising, a smaller number than the 38 percent reporting that overall expansion of budgets would be the source.
Other sources for funds include digital display advertising (32 percent), search advertising (10 percent), digital video advertising (nine percent), owned social media (eight percent) and paid social media (also eight percent).
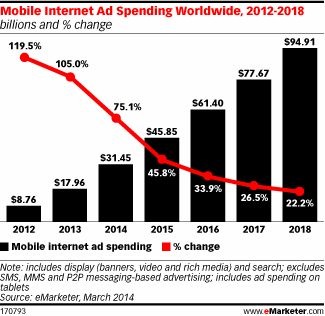
With the expansion set to continue over the next few years, it’s likely these trends will continue to rise. eMarketer reports that US advertisers will pick up its spending on mobile ads by 78 percent, with a total of nearly $19 billion. It’ll grow even further into the next year, with a 50 percent growth rate to $28.48 billion. But, again, that’s nothing compared to where spending will be by 2018, which is expected to rise 20 percent to reach a whopping $58.78 billion.
Advertiser Perceptions also reported that smartphones were better than tablets when it came to delivering ad results, including impressions and return on investment. In nearly every category, smartphones outperformed tablets on every level, including audience (smartphones’ 38 percent to tablets’ 13 percent), results (36 percent to 22 percent) and targeting (36 percent to 12 percent, nearly three times worth). Only in areas like engagement (27 percent to 36 percent), platform for advertising (tied at 25 percent apiece), brand safety (18 percent to 20 percent) and user experience (17 percent to 49 percent) did tablets fare better. The chart is below, and also highlights how some advertisers believe they are the same, particularly with audience.