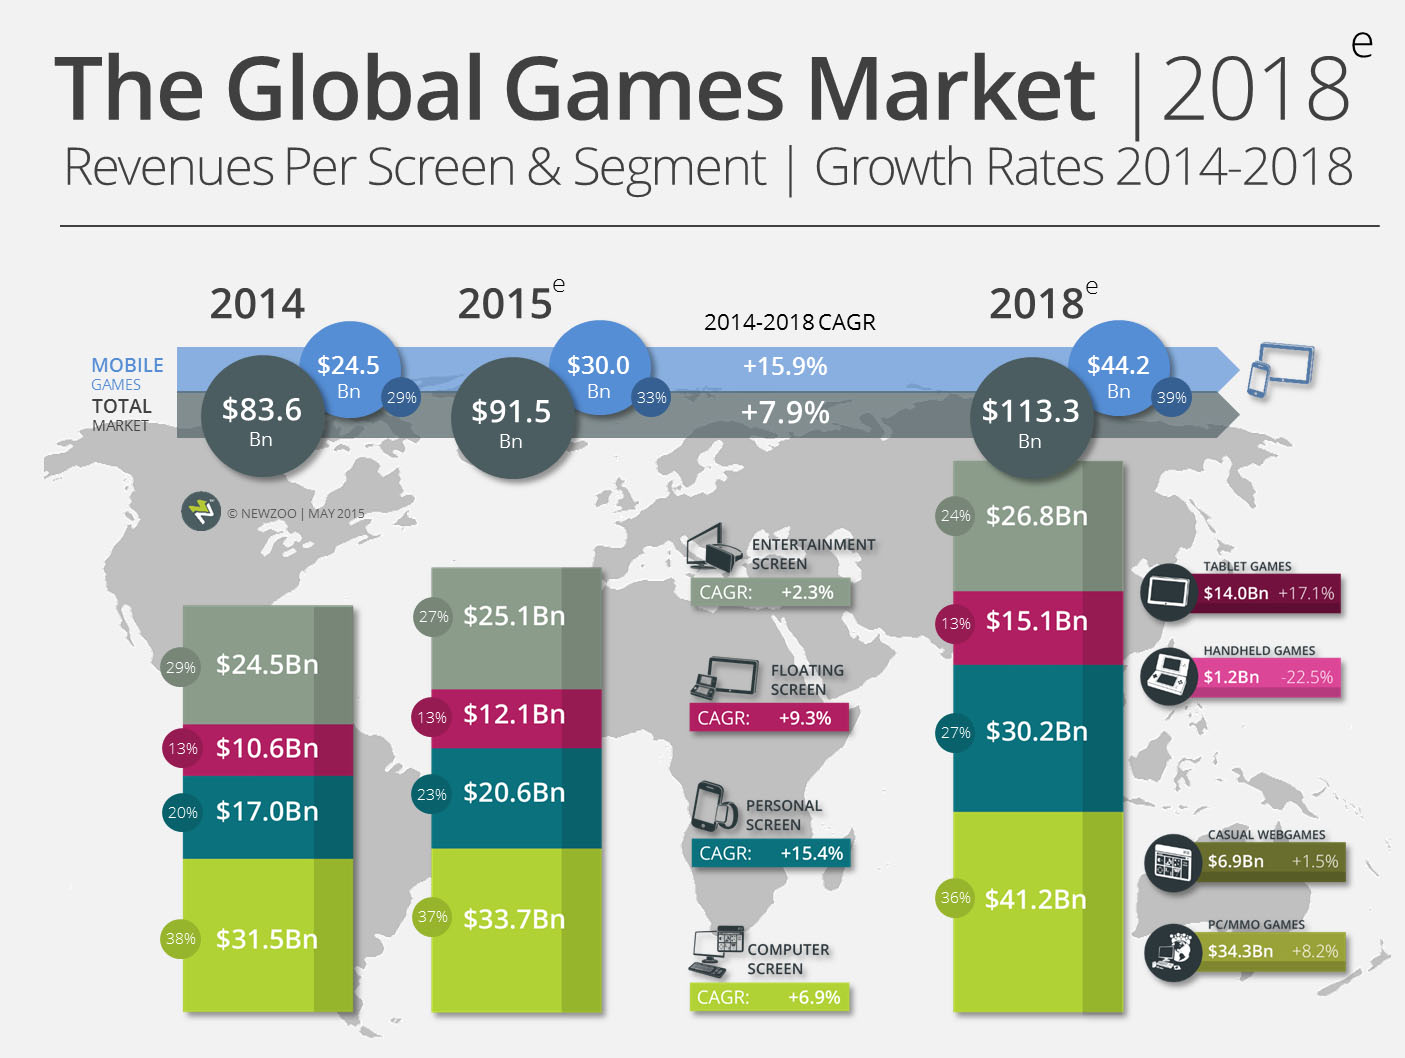
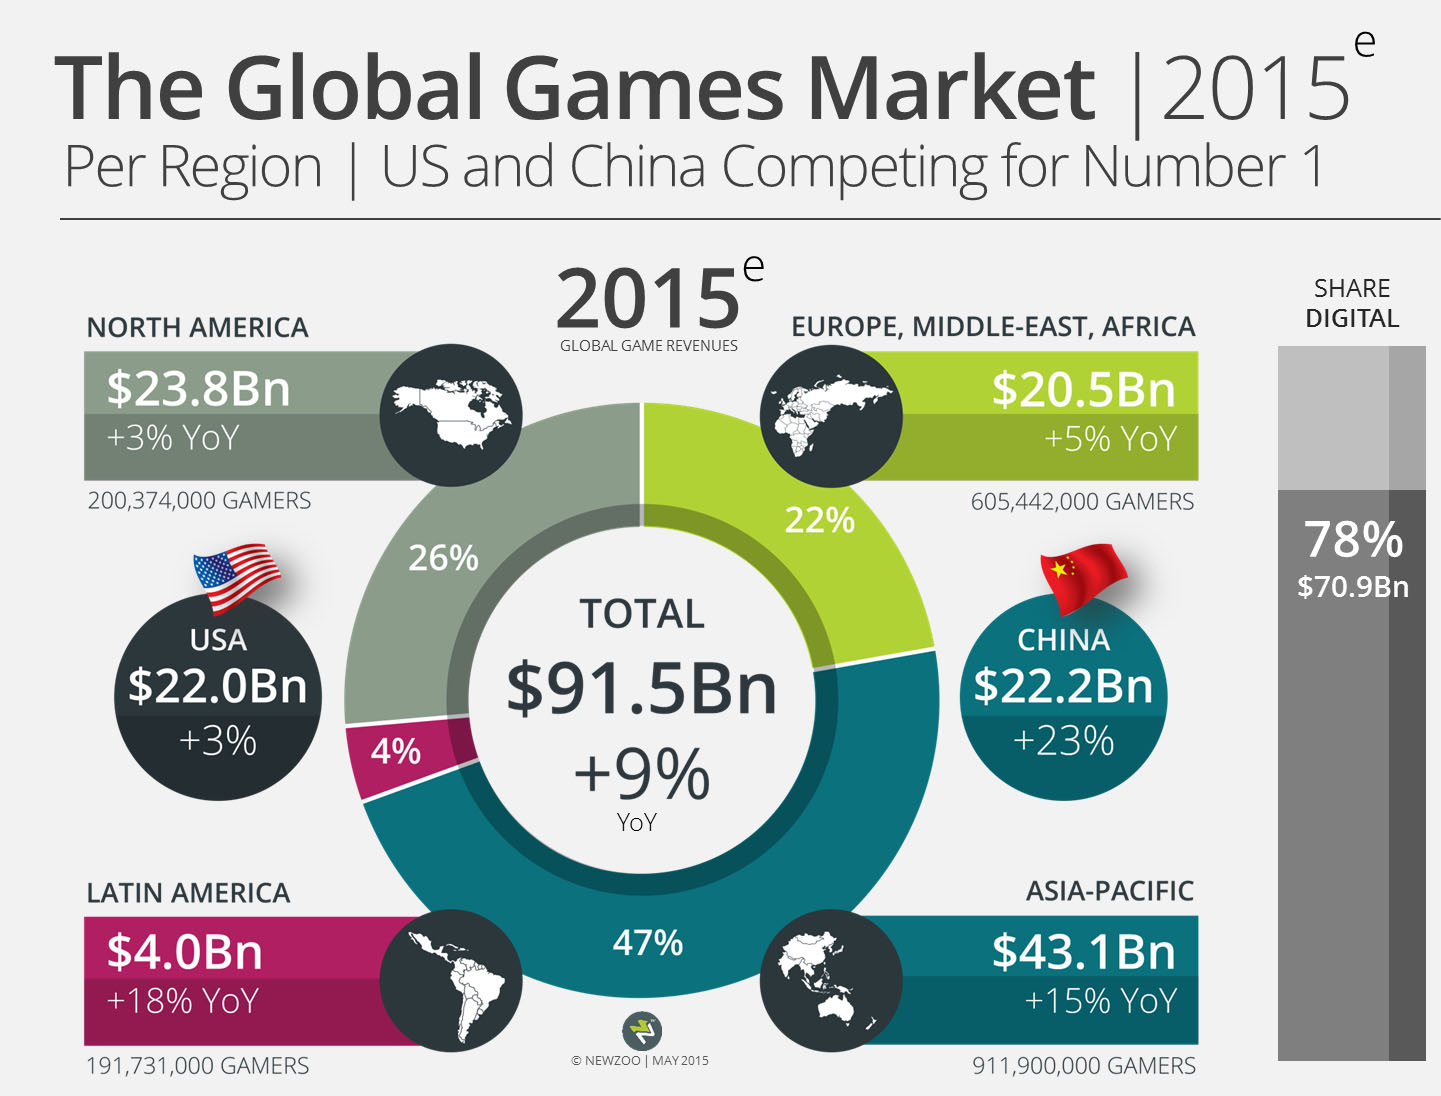
The upcoming 2015 Global Games Market Report by market research and predictive analytics firm Newzoo shows that the worldwide games market will reach $113.3 billion by 2018. This represents a 2014 to 2018 Compound Annual Growth Rate (CAGR) of +7.9 percent. The market for (smart)phones and tablets will rise from $30.0 billion this year to $44.2 billion in 2018, ultimately taking 39 percernt of the global games market. In 2015, China and the US are neck and neck for number one market, with China expected to outgrow the US by the smallest of margins: $22.2 billion versus $22.0 billion. By 2018, China and the US will grow to $32.8 billion and $24.1 billion games markets respectively, together claiming 50 percent of the world’s games revenues. Newzoo’s annual Global Games Market Report, to be launched on June 8th, is available for pre-order as of today. The report will include gamer and revenue projections by region, country and segment towards 2018, as well as the top trends that will define success several years from now.
Global Growth Per Screen Towards 2018
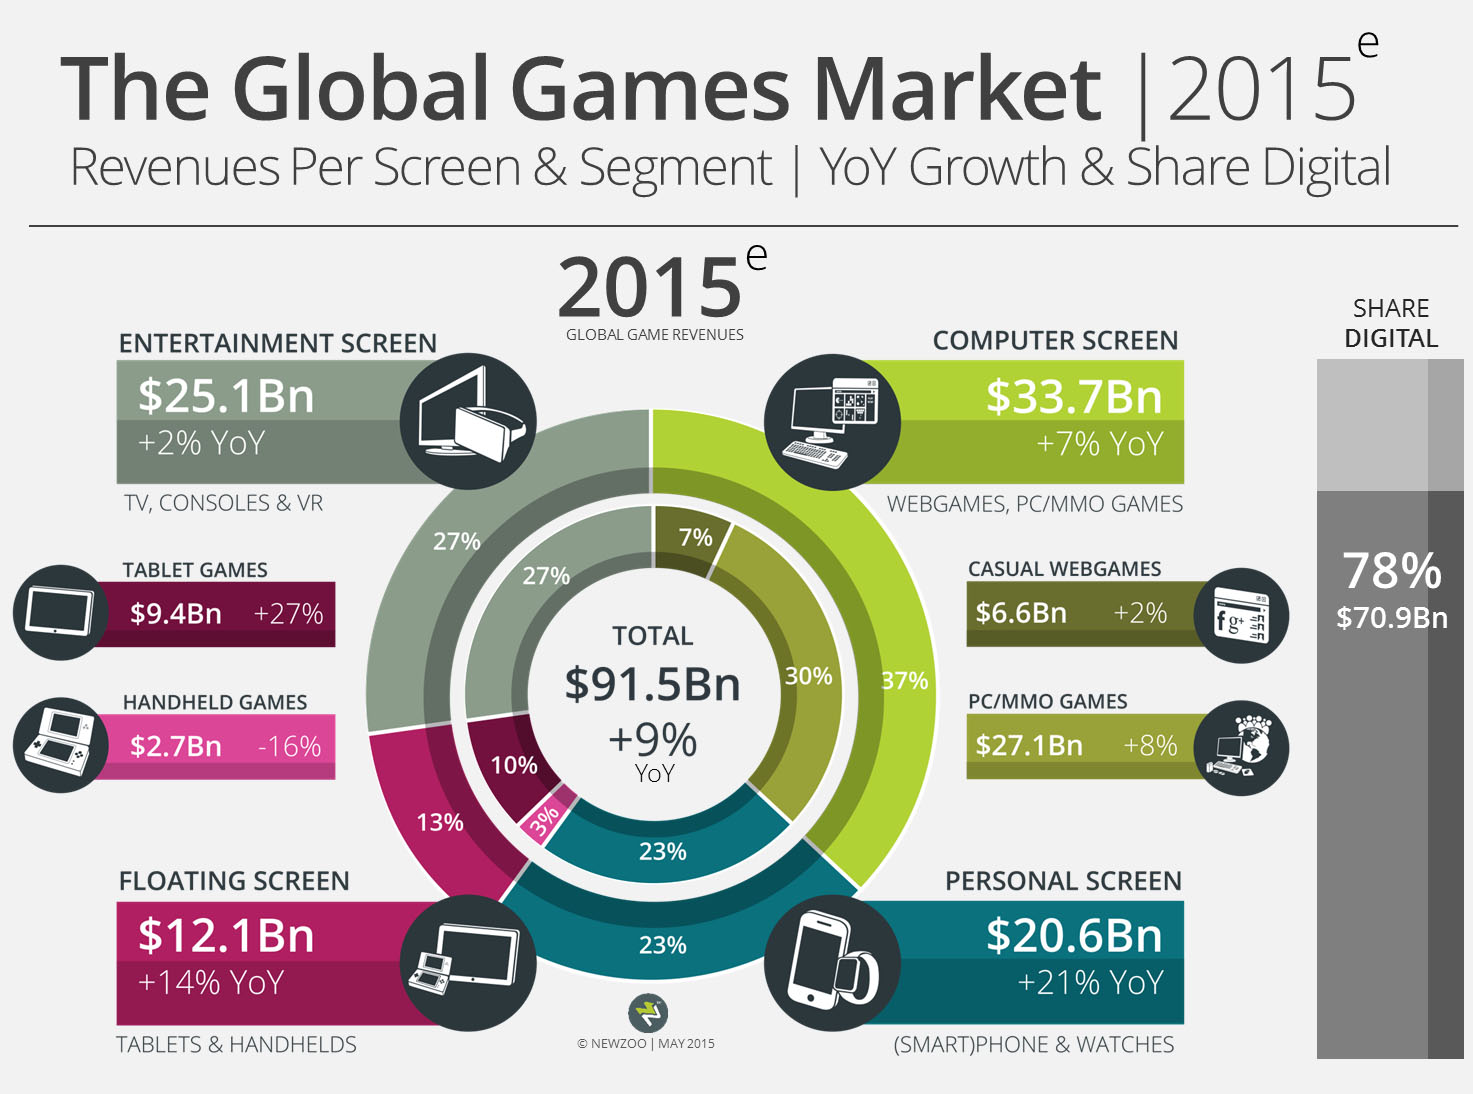
As the market has evolved and the boundaries between traditional market segments have disappeared, Newzoo’s Screen Segmentation Model, introduced in early 2012, has become the primary model for understanding and sizing growth opportunities. The Computer Screen (PC/Mac) with $41.2 billion will account for 36 percent of the market by 2018 and will remain the most revenue generating screen, growing at a robust CAGR of +6.9 percent driven primarily by PC/MMO games. The Entertainment Screen (TV/Console, VR) with $26.8 billion will have 24 percent of the market by 2018, down from 27 percent in 2015. Both the Computer Screen and the Entertainment Screen will lose a small portion of their share to the continuously growing Personal Screen (Phones, Smartwatches). In 2018, the Personal Screen with $30.2 billion will account for 27 percent of the pie, leaving 13 percent for the Floating Screen (Tablets, Handhelds). The decline of the handheld console market (CAGR of -22.5 percent) will be offset by the robust growth of tablet revenues (CAGR of +17.1 percent), resulting in the Floating Screen maintaining its market share towards 2018. This year, digital game revenues will account for 78 percent of the global market totaling $70.9 billion, up from a 74 percent share in 2014.
US & China Take 50% of the Global Games Market in 2018
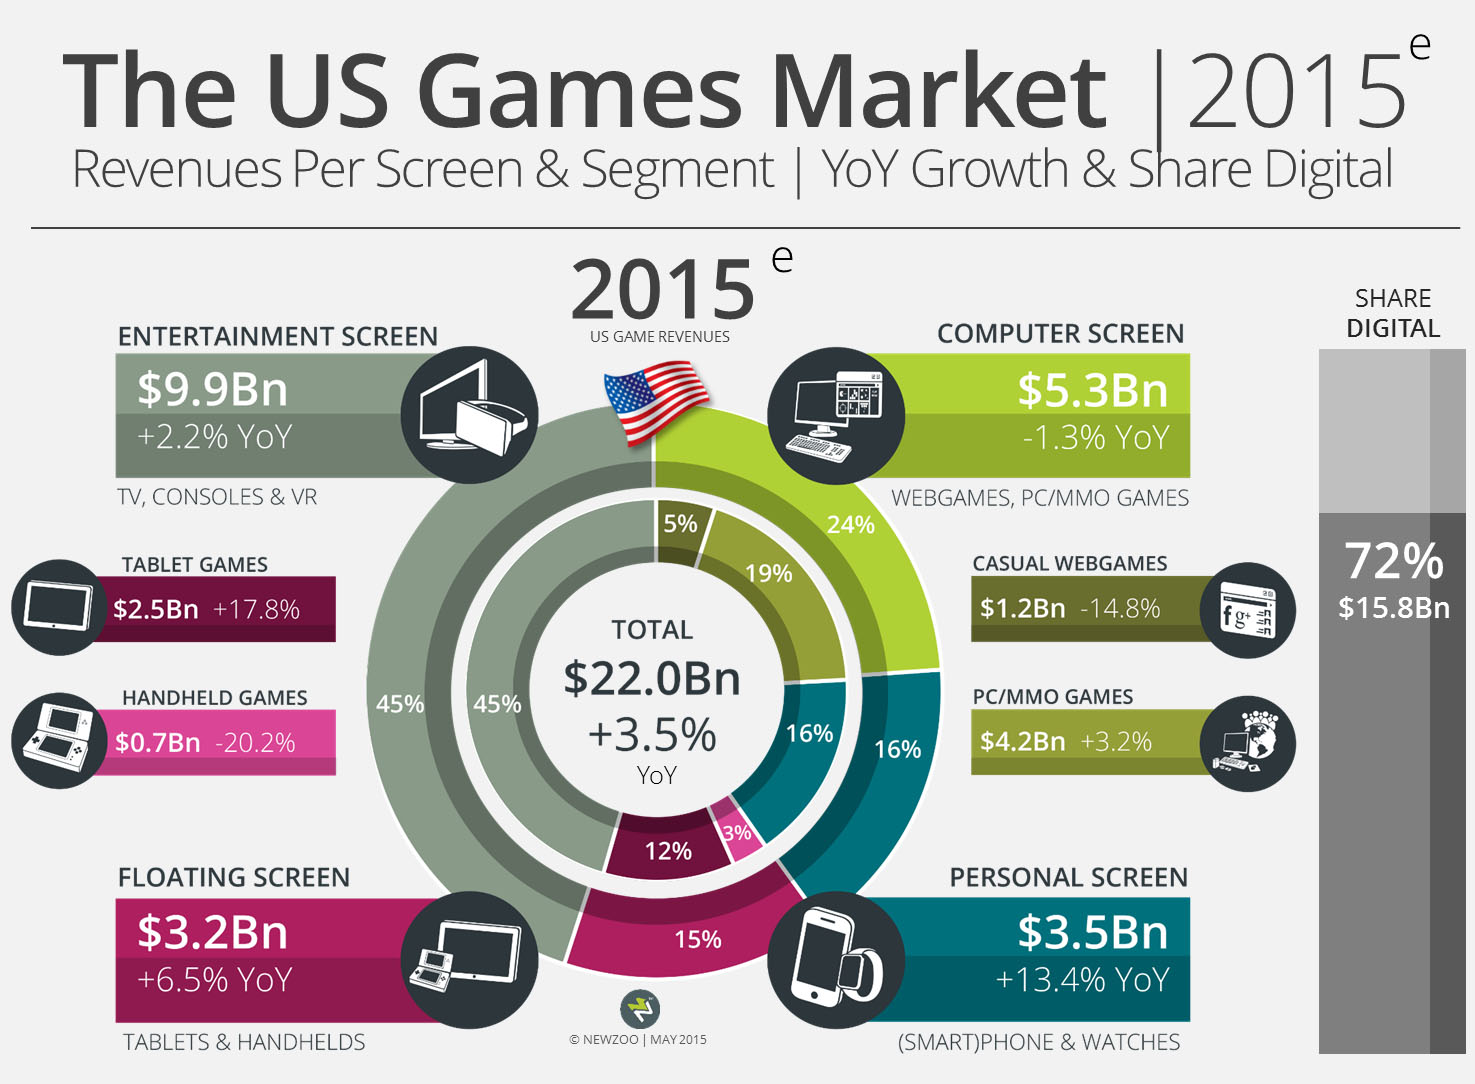
As previously reported, China could move ahead of the US and become the world’s largest games market by revenues this year. In 2015, Chinese revenues are expected to reach $22.2, just surpassing US revenues of $22.0 billion. A notable difference in the two markets can be seen in digital games sales; in 2015, the share of digital to total revenues in China is expected to reach 97 percent (or $21.4 billion) versus 72 percent (or $15.8 billion) in the US. Comparing 2015 revenues per screen, the Chinese games market is dominated by the Computer Screen (PC/Mac), with 68 percent of total revenues, while the Entertainment Screen (TV/Console, VR) continues to prevail in the US, with 45 percent of the market. In both countries, mobile segments have been growing with huge impact, but while the US mobile market is showing signs of maturing, China’s is still on the uptake. This year in the US, smartphone games and tablet games will still see YoY growths of +13.4 percent and +17.8 percent respectively. In China, tablet games will see a YoY growth of +39.0 percent, while smartphone games will jump an outstanding +50.0 percent. Overall, China’s games market will grow at a CAGR of +16.1 percent to reach $32.8 billion in 2018, while the US will grow at a CAGR of +3.1 percent to reach $24.1 billion in 2018. Together, they will account for 50.1 percent of the global games market, up from 47.0 percent last year.
Newzoo’s Global Games Market Report & Service Methodology
Newzoo performs continuous analysis of the global games markets and individual public and non-public company performance. To generate reliable player and revenue data on a global level as well as for the top 130 countries in the world, we combine an array of data sources, including primary consumer research in 26 countries, quarterly revenues of public companies, transactional data and third-party research. Forecasting also involves market trending analysis and projections for macro KPIs, such as population growth, online/mobile connectivity and economic growth for all countries in the world.