
A new report from AppsFlyer has broken down the success of Apple’s App Store, which has managed to reach $71 billion in app revenue to date—though the majority of profits aren’t coming from in-app purchases.
The report, titled “State of In-App Spending,” looked at over 100 million users across over 1,000 different apps to tally up its totals, and based on what was found, more revenue was made from in-app revenue and paid applications, instead of in-app ads.
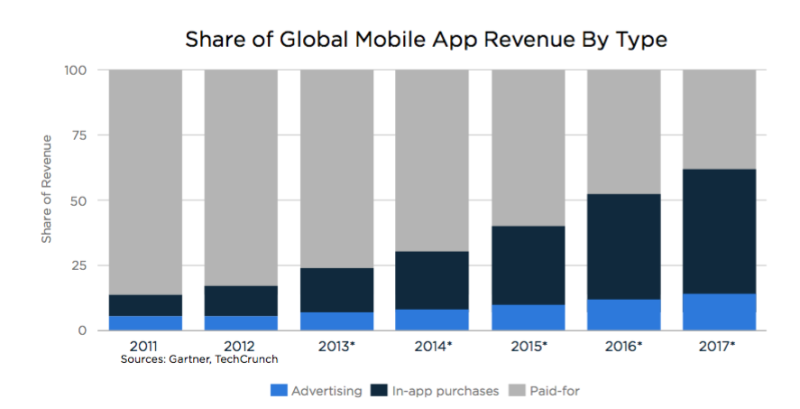
The chart below shows just how much numbers has changed over the years. In 2011, paid-for applications dominated the Apple App Store by well over 75 percent. However, this year, it’s dwindled to under 50 percent, with the rest being made up by in-app purchases and advertising. That said, even though in-app ads have dropped into the minority, they’ve continued to show an increase over the years, and will continue to slightly bump up going into 2017.
“Our data showed that only about 3.5 percent of gamers spend money in-app, but those users are big spenders, spending 30 times more than the average gamer (paying and non-paying) with $9.39 vs. $0.32 a month per gaming app,” the report states.
The report noted that “the average global paying user spends $9.60 a month per app, which is 20 times more than the average user.” That said, it also noted that only about 5 percent of app users make purchases overall—a very small minority of overall users.
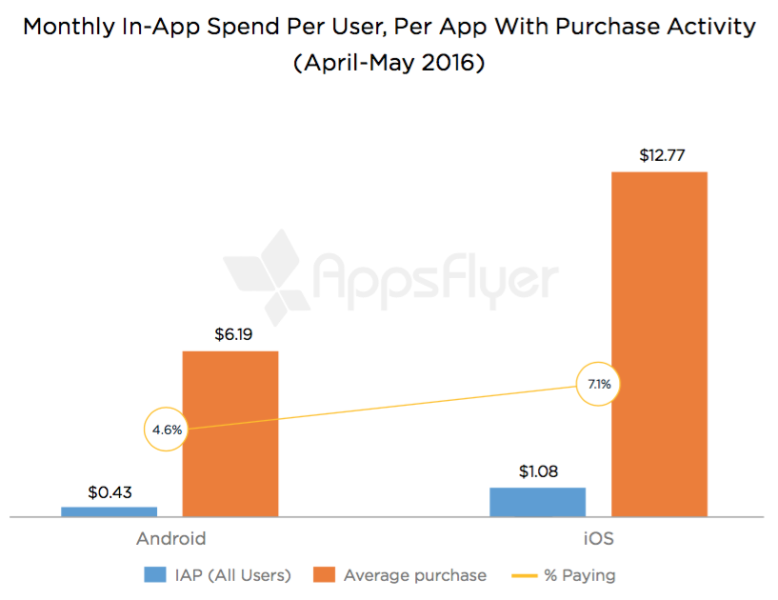
Another chart breaks down the monthly in-app spend per user for April and May 2016, with more being spent on iOS. All users spent around $1.08 per month, while the average purchase is around $12.77—that’s more than double the $6.19 spent on the Android platform, across the $.43 spent by all users.
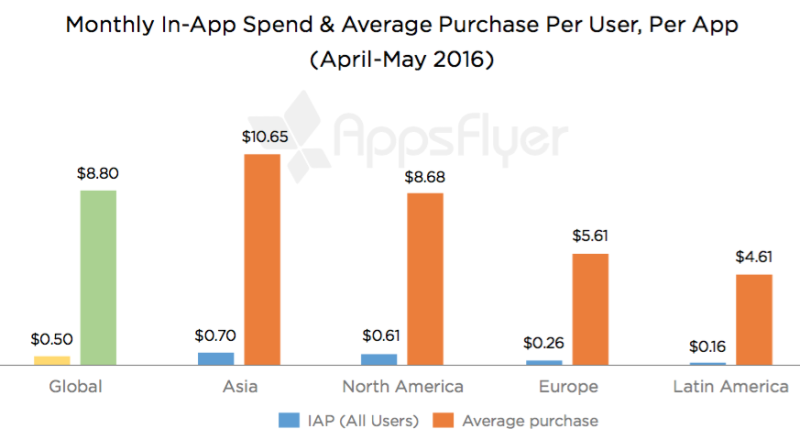
Breaking numbers down by region, Asia continues to be the defining leader when it comes to monthly in-app spend and average purchases per user, with $.70 per user and $10.65 per average purchase. North America is close behind with $.61 for all users and $8.68 average purchase, close to the global average.
The report also made note in specific categories, with shopping apps leading the charge. The average monthly in-app spend in this category is $2.68—well over two and a half times the $.32 spent on gaming apps. (Keep in mind that most of them are free-to-play.)
“As app developers lay out their development, marketing and engagement strategies, it is critical for them to understand the differences in in-app spending behaviors across different platforms, geographic regions and app categories,” said Ran Avrahamy, AppsFlyer’s vice president of marketing. “Our data shows that in-app spending continues to present a significant opportunity for app publishers and marketers. While only a small portion of app users actually spend money on in-app purchases, app developers and marketers can capitalize by ensuring they always offer an optimal in-app experience, and by constantly measuring and optimizing their activities in order to build a strong base of loyal, valuable users.”