Social networking has come a long way over the last ten years. In 2005, barely anyone managed to use the Internet for communication. Now, most adults can’t seem to get through the day without it.
This report from the Pew Research Center breaks down just how much social media has grown over the last ten years. Sixty-five percent of adults use social networking site to some extent, which is a long way from the seven percent that were using it ten years ago. This is through many uses, such as work, politics, or general social use, along with getting information in vital areas such as health, civic life and dating.
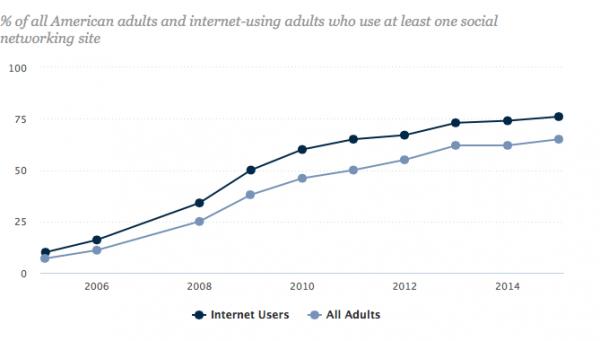
The chart above shows the slow but steady growth for social media, not just with adults but all Internet users. As you can see, both categories increased with each coming year, eventually reaching the high point they’re at now. And that’s not likely to slow down anytime soon, with the continued growth of sites like Twitter, Facebook and others.
As for breakdowns across demographic groups, PRC broke down the statistics below, taken straight from the report:
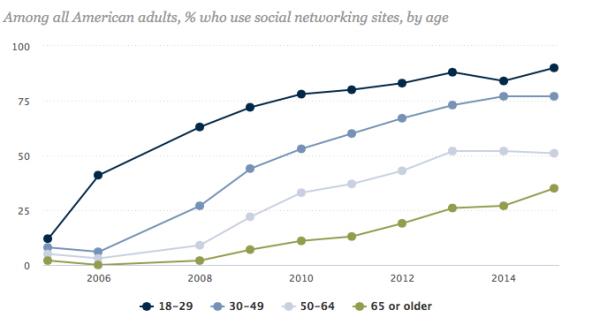
Age differences: Seniors make strides — Young adults (ages 18 to 29) are the most likely to use social media — fully 90 percent do. Still, usage among those 65 and older has more than tripled since 2010 when 11 percent used social media {link no longer active}. Today, 35% of all those 65 and older report using social media, compared with just 2% in 2005.
Gender differences: Women and men use social media at similar rates — Women were more likely than men to use social networking sites for a number of years, although since 2014 these differences have been modest. Today, 68 percent of all women use social media, compared with 62 percent of all men {link no longer active}.
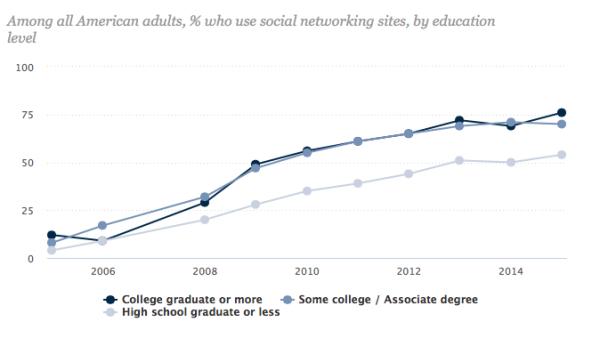
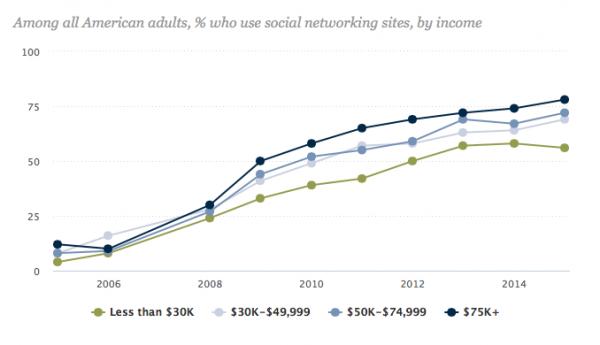
Socio-economic differences: Those with higher education levels and household income lead the way – Over the past decade, it has consistently been the case that those in higher-income households were more likely to use social media. More than half (56 percent) of those living in the lowest-income households now use social media, though growth has leveled off in the past few years. Turning to educational attainment, a similar pattern is observed. Those with at least some college experience have been consistently more likely than those with a high school degree or less to use social media over the past decade. 2013 was the first year that more than half of those with a high school diploma or less used social media.
Racial and ethnic similarities: There are not notable differences by racial or ethnic group: 65 percent of whites, 65 percent of Hispanics and 56 percent of African-Americans use social media today {link no longer active}.
Community differences: More than half of rural residents now use social media — Those who live in rural areas are less likely than those in suburban and urban communities to use social media, a pattern consistent over the past decade. Today, 58 percent of rural residents, 68 percent of suburban residents, and 64 percent of urban residents use social media {link no longer active}.
Despite this information, however, young adults seem to be the most likely to use social media. Ages 18-29 seem to be the biggest demographic, with 90 percent of young adults using it, compared to 12 percent ten years ago. The chart below breaks down just where these groups differ from 2005 to today, and, as you can see, each one shows a significant increase.
Then there are genders. Back in 2005, only eight percent of men and six percent of women used social media. Oh, how far it’s come since then.
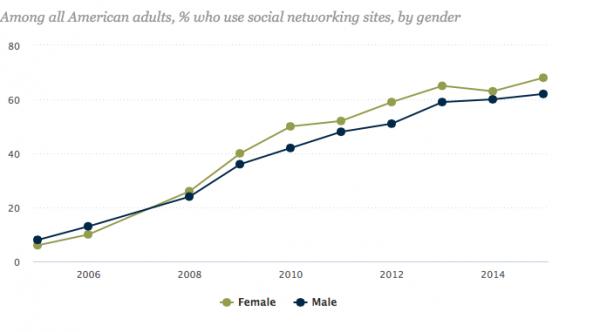
By today’s numbers, 68 percent of women and 62 percent of men say they use social media to an extent, although the differences are minor in the long run.
But what about education That’s broken down as well, with 70 percent of those with some form of college education and 54 percent of those with a high school diploma use social media to some extent. The chart below shows the differences with the groups, and they aren’t that far apart.
Finally, economics were measured, but, as provided by the chart below, the numbers aren’t all that different between those that make less than $30,000 a year and those that make over $75,000. Seventy-eight percent of those in the highest-income households use social media, while 56 percent in lower brackets use it. That is a 22-point difference, but, again, the increase is about the same.
The full report, with even more statistics on use by community and race, can be found here. {link no longer active}.