While only 22 percent of American digital advertisers used retail media as a part of their strategy in 2022, per Statista, many marketers are changing their view of its bottom-funnel capabilities. While analysts predict digital ad spending will grow by just 7.8 percent this year, retail media network spending is projected to rise by 9.9 percent, per RetailWire, with retail media ad sales projected to soar by 19.7 percent per eMarketer. A recent report by LiveIntent based on a survey of over 200 U.S. marketers revealed that most respondents are now bullish on retail media and plan to shift their budgets toward retail media networks.
Marketers Want More Retail Media Inventory And Measurement Capabilities
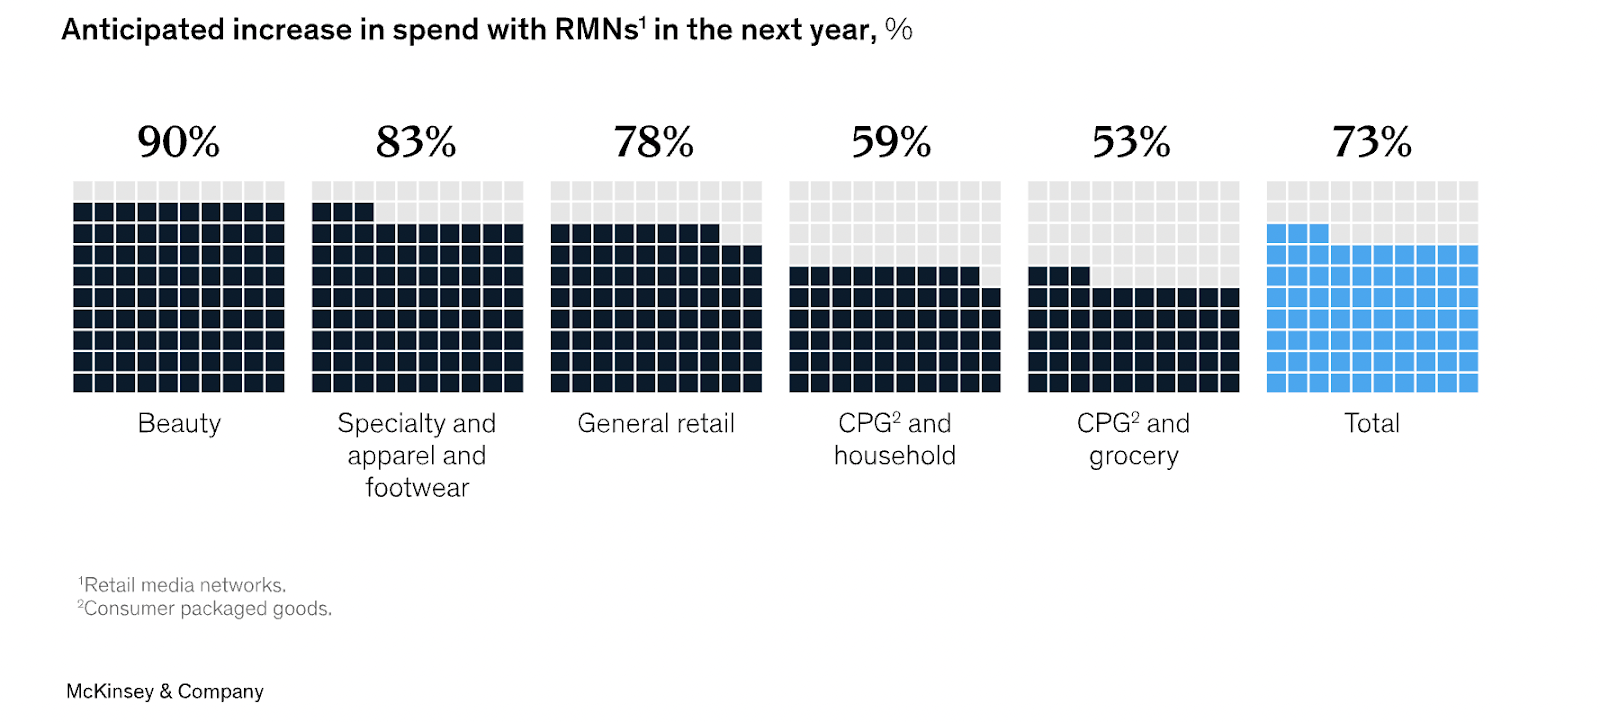
According to LiveIntent’s “The 2023 Retail Media Market Report: Unlocking Adoption, Mastering Best Practices, Overcoming Challenges & Driving Performance,” 63 percent of marketers surveyed stated that they saw retail media advertising as more effective than other digital channels, with 73 percent saying that they planned to increase investment in 2023.
According to the report, marketers saw retail media networks as a locus of new opportunities to engage audiences and glean valuable insights. Per the survey findings:
- Seventy percent of advertisers believe retail media networks will likely increase customer engagement and sales for retailers.
- Sixty-five percent of retailers think that retail media can provide them with expanded revenue opportunities for advertising and sponsorship.
- Fifty-six percent of retailers see retail media as a significant source of first-party data to support a user experience personalization strategy.
- Forty-five percent of retailers believe building the employment of retail media will be first-party data as third-party cookies become obsolete.
Approximately 60 percent of advertisers planned to use retail media networks to target customers with discounts, deals, and relevant search ads. Another 43 percent planned to use retail media content with AR or VR content.
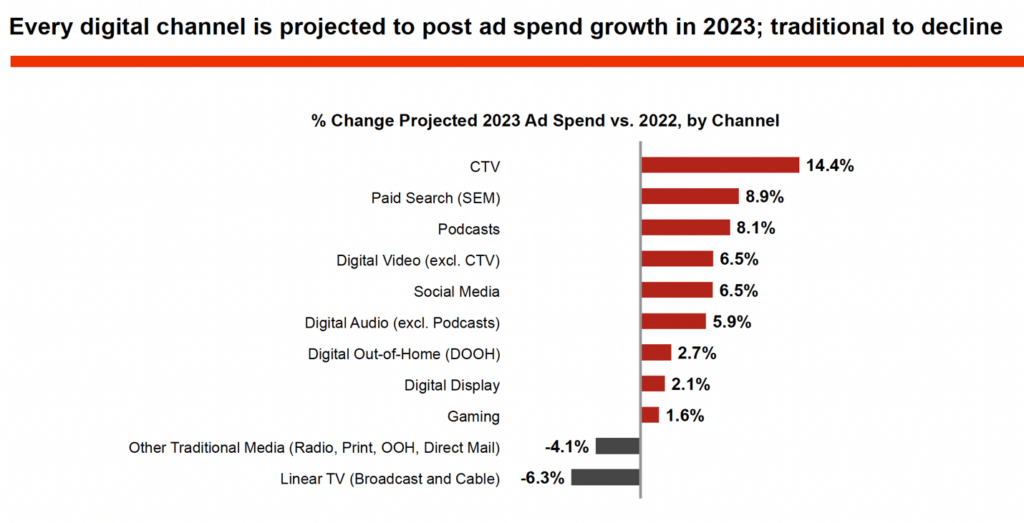
Advertisers also stated they want access to more video (64 percent) and connected TV and streaming (57 percent) options. That tracks with recent findings from Insider Intelligence which reports that by 2024, retail media will be the fastest-growing ad format, outpacing linear TV ad spending by 2025.
There’s also a lot to love with respect to retail media’s access to consumer data, according to marketers surveyed by LiveIntent. Logged-in consumers opt-in to data sharing while on retail sites. This makes targeted and audience analytics simple for retailers and brand marketers. It allows them to harvest consumer preferences, purchase, and search consumers that can direct and enrich real-time targeting and optimize user experiences.
Fifty-six percent of marketers surveyed believe retail media will lead to more relevant and engaging deal offers, and 59 percent of respondents believe retail media can also enhance in-store consumers’ shopping experiences. But there are caveats. While retail media networks can earn a profit margin of as much as 80 percent from ad sales, 44 percent of advertisers in the LiveIntent report cited problems with accurate campaign measurement as an ongoing issue. That’s a powerful motivation for retail media networks to relentlessly promote their channels even when they cannot offer marketers the tools they need to drill down and examine granular performance insights.
“Many of our clients are spending a lot of money advertising on retail media networks (RMNs) – especially on retail search channels,” According to April Carlisle, EVP of Spark Foundry, speaking to Ad Exchanger, “But they’re still just hitting the same households.”
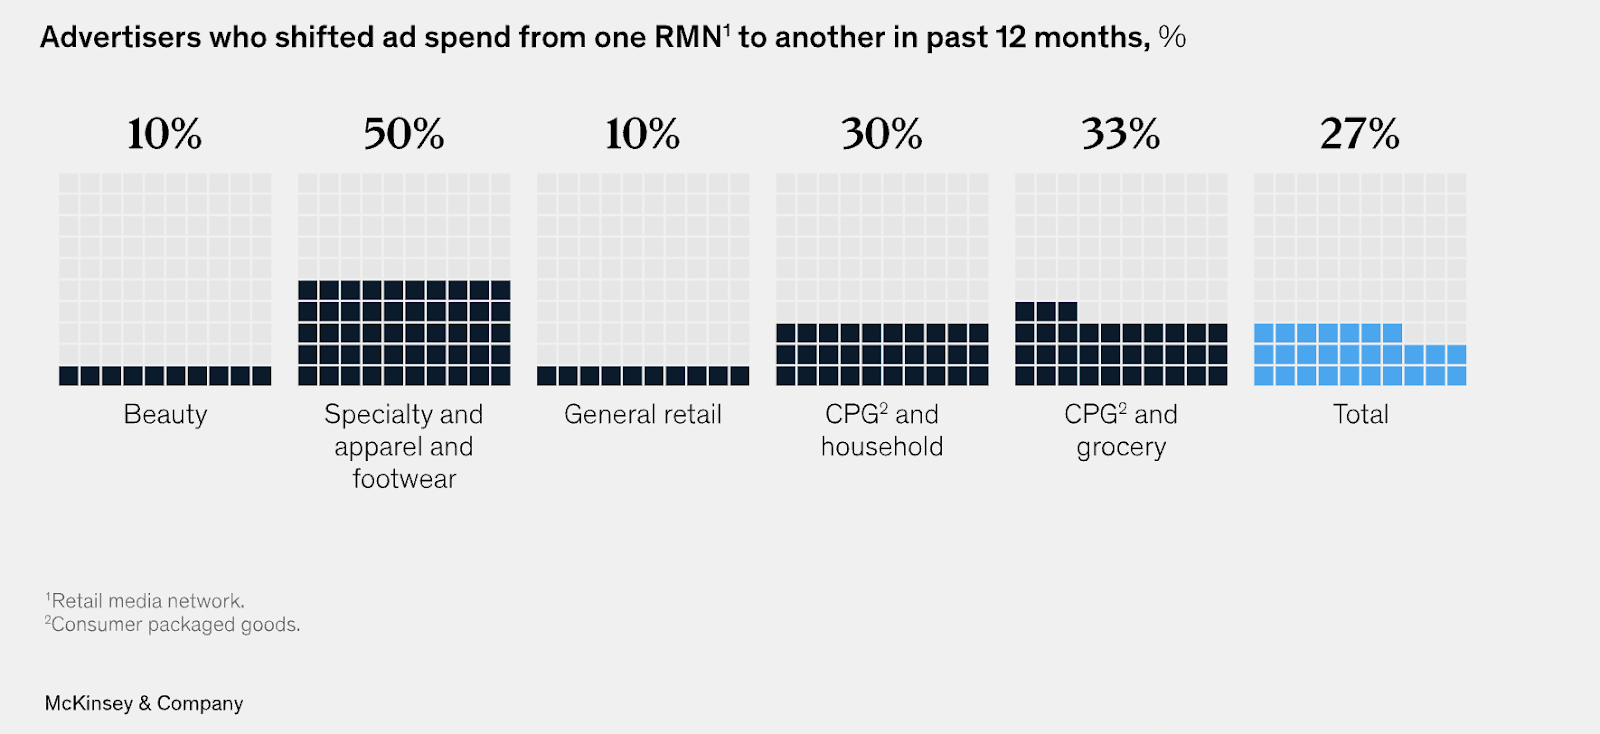
As the number of RMNs grows, marketers are faced with a lot of choices, but the need for better results may be driving brand marketers to use a wide range of networks in a trial-and-error fashion, even when performance is lackluster.
Source: McKinsey & Company
Marketers Now Use Multiple Retail Media Networks To Drive Sales
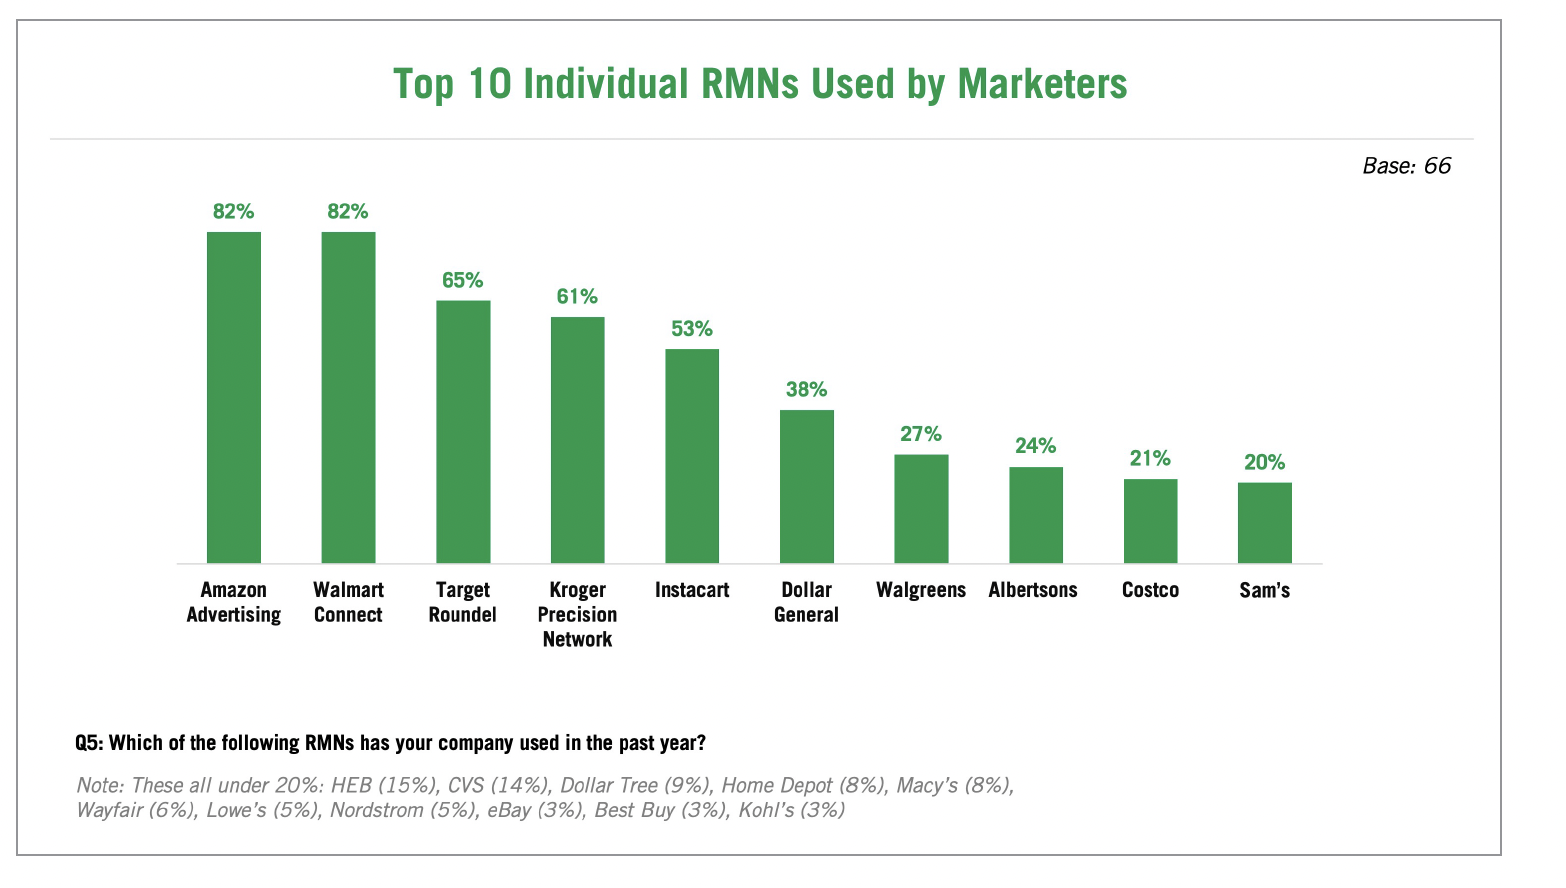
According to a recent report by The Association of National Advertisers, 75 percent of advertisers using retail media networks (RMNs) cite driving new sales as their most crucial goal in using RMNs, with fifty-six percent employing five or more retail media networks (RMNs) and 40 percent use five to nine different RMNs. Sixteen percent use ten or more RMNs.
Source: McKinsey & Company
“As budgets get cut,” the report quotes one survey respondent, “RMN programs have remained largely intact. This is shifting the balance of our overall marketing budget from building brand equity to driving product sales.” The report states that fifty-eight percent of advertisers surveyed expect to be using more RMNs than they are today by 2024, and 73 percent expect to be spending “somewhat or significantly more” on RMNs than they did in 2022.
Source: ANA
While brand marketers are looking at traditional metrics like return on advertising spend (ROAS), they are also looking at other metrics that offer deeper insights, such as “new-to-brand,” to assess which RMNs drive the highest sales and awareness.
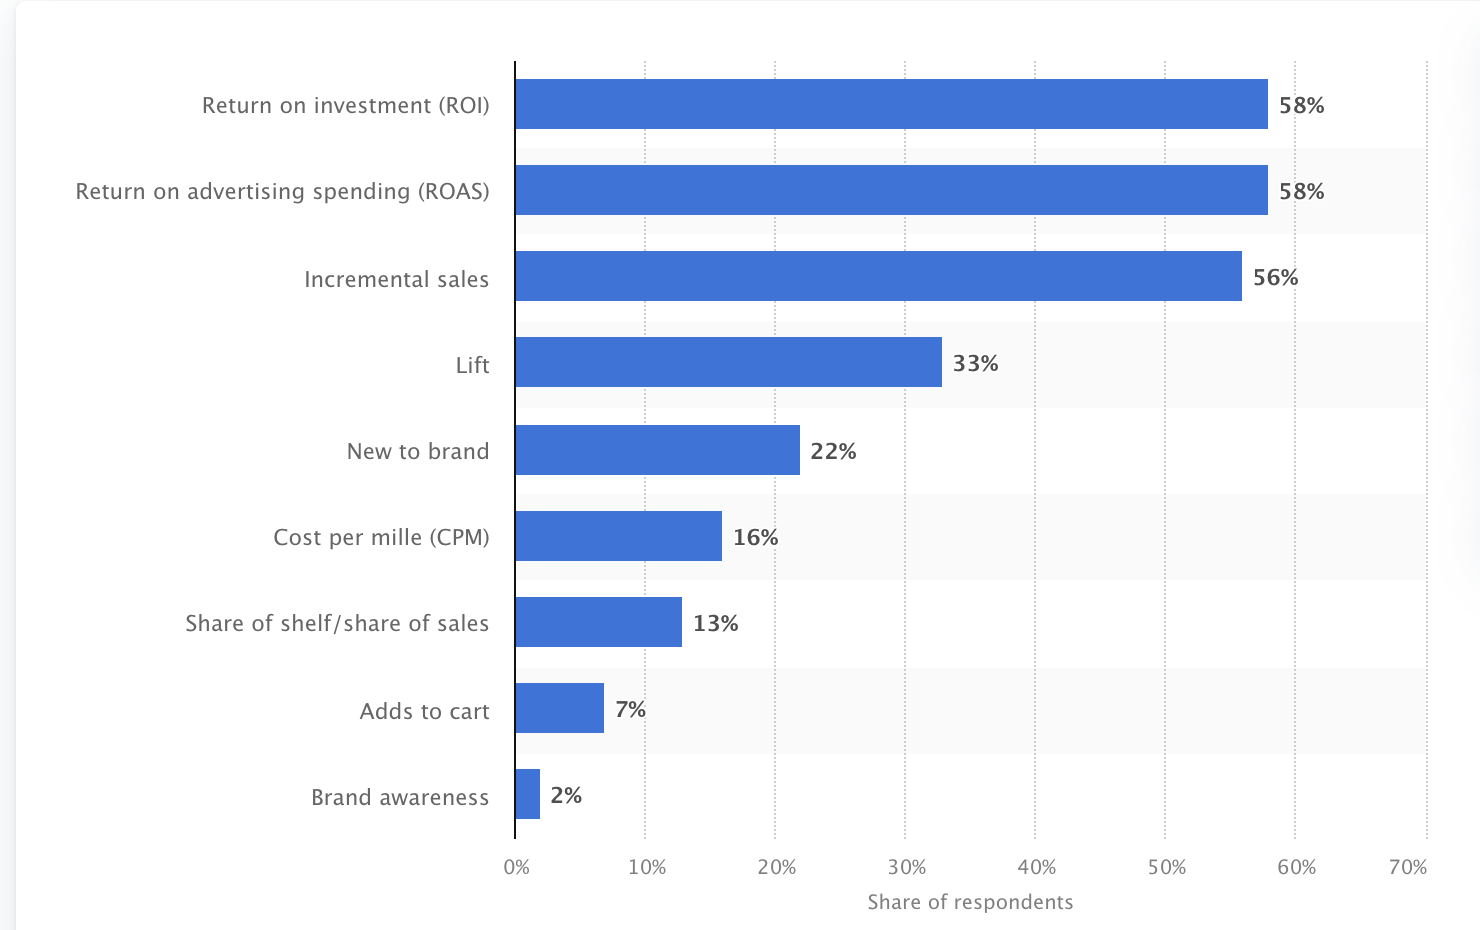
Source: Statista
The Takeaway for Marketers: As behemoths like Walmart expand their RMNs, marketers are shifting spending toward retail media for its bottom-funnel capabilities and access to first-party data from logged-in users. Yet advertisers need more certainty in determining which RMN will offer the best value over time. Because the marketplace is fragmented, access to accurate real-time performance data will be vital in avoiding wasted spend. Marketers should also attempt to leverage tools to compare historical and current results between RMNs over time. Incremental sales can be an essential revenue source. Logged-in RMN consumers may scale their purchasing behavior as marketing content stokes engagement. However, marketers may miss opportunities to convert them without access to a comprehensive, multi-platform analytics tool.