It’s probably no surprise that in-app spending is expected to increase over the next few years. From beating a level with the help of game add-ons to booking that adorable bed and breakfast, the app market continues to expand into emerging demographics across the world.
It might come as a surprise, however, to learn that geography, operating systems and app category all impact in-app spending in different ways. For example, iOS users spend two-and-a-half times more than Android users per month because they tend to be less price-sensitive, according to a new report from AppsFlyer. Android users, meanwhile, spend five times more than iOS users on utility apps like anti-virus and memory boosters because of the open Android OS platform.
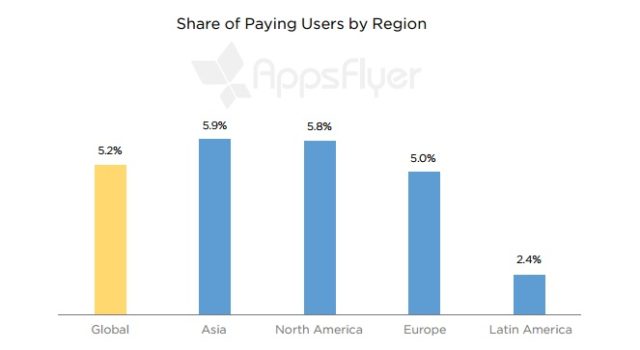
The report, titled The State of In-App Spending, measures over $300 million of in-app purchases by more than 100 million users from April to May 2016. The results may vary considerably, but don’t fall into that pit of marketing despair just yet—it’s all about knowing your audience.
Asian Users Spend The Most Per App
According to the report, these users spend $0.70 per month per app as opposed to the average global user, who spends $0.50 a month per app. Gaming apps are especially popular in the Asian market, with users spending 75 percent more on in-app purchases than users in other regions. According to IDC’s new Worldwide Semiannual Mobility Spending Guide, enterprise and consumer spending on mobile devices and related software and services in Asia/Pacific (excluding Japan) will grow at a compound annual growth rate (CAGR) of three percent from $514 billion in 2015 to $578 billion by 2019, making it the largest region in the world in terms of mobile spend.
“Mobility has had a significant influence in Asia, creating unique markets and business models that cater to a new generation of consumers embracing a mobile-first world,” said Avinash K. Sundaram, research manager for enterprise mobility at IDC Asia/Pacific. “A great example of this trend is WeChat in China, which started as a messaging app rival to WhatsApp but has now transformed itself into a social commerce platform where consumers find and pay for services ranging from food to movies and even transportation.”
North Americans Love To Shop
The average North American shopper spends $43 per in-app purchase, compared with the average Asian shopper who spends the equivalent of $11. In fact, North American retail app users outspend all regions in this category—the average European retail app user by two-and-a-half times, and the average Asian shopper by more than three times.
According to a June survey conducted by global polling firm, Penn Schoen Berland, around 60 percent of parents are planning to buy at least one thing on a mobile device and 30 percent plan to do at least a quarter of their shopping on mobile. (Based on 1,500 individuals surveyed)
Gamers And Shoppers Have Very Different App Spending Habits
Only about 3 percent of gamers make in-app purchases, while 12 percent of those using shopping apps pull out their credit cards. These figures are attributed to intent (presumably you would download a shopping app with the intent to purchase), as well as the vastly different costs of virtual versus physical goods ($7 versus $36.54 average purchase amount).
The Whales Of Latin America
AppsFlyer data shows that gamers who do make in-app purchases tend to spend significantly more than the average gamer—30 percent more, in fact. This is known as the “whale” phenomenon, and these users become the main source of income for free-to-play games. There are many such “whales” in Latin America, it turns out, who are spending 48 times more on in-app purchases than the average Latin American user. Although Latin American app users spend an average of about half of users in other markets, those who do spend big.