The daily time spent by consumers on smartphones and tablets continues to increase, although the growth of that increase is slowing down.
eMarketer reports that non-voice time spent on tablets and mobile phones alike will grow 11.3% for this year, to 2 hours and 54 minutes. That percentage may look pretty significant, but the growth rate is beginning to level out as less time is being spent with other media.

“As the data shows, a large majority of American adults are already using mobile devices,” said Monica Peart, forecasting director for eMarketer. “That means there will be fewer new smartphone and tablet users added each year. Also, the number of activities currently possible on mobile devices limits the amount of time a user can spend per day. For these reasons, growth in the amount of time spent on mobile devices will slow down significantly.”
The utilization of apps, however, continues to grow as opposed to web browsing. This time is expected to increase by ten minutes in 2016, while the use of mobile browsers will continue to be around 51 minutes. The chart below breaks this down more specifically.

But even with the drop-off, mobile is still showing progress in daily usage while traditional television is stumbling a little bit. The report indicates that traditional TV viewing has dropped 4.1 percent over the past year, down to four hours and 11 minutes. That number is expected to drop another 3.1% next year, to just over four hours.

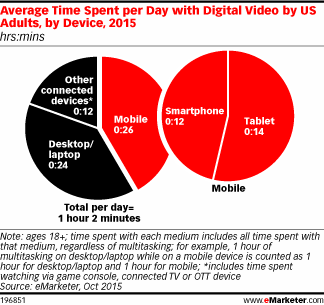
This third chart shows the average time spent per day with digital video, and as you can see, there are stark differences between mobile, desktop and other devices.
Radio also plays a part in this report, as traditional radio will decline by just about a half hour between this year and the next, while digital radio will see an increase to 54 minutes by next year.
Digital consumer behavior has changed in other areas as well, based on this report from Digital Context Next that breaks down comScore’s recent 2015 U.S. Digital Future in Focus report. There are a number of takeaways from this report, including the following:
- While most of the growth in digital media consumption over the past four years has occurred on smartphones (up 394%) and tablets (up 1,721%), these mobile platforms are not eating into aggregate time spent on desktop, which has still grown 37% over this time period. The digital media pie continues to get bigger and Americans engage with screens during more occasions throughout the day than ever before.
- Across every age demographic, there is a substantially higher percentage of multi-platform and mobile-only internet users than the previous year. More than 3/4ths of all digital consumers (age 18+) are now using both desktop and mobile platforms to access the internet, up from 68% a year ago. Mobile-only internet usage is also becoming more prevalent, driven largely by the 21% of millennials who are no longer using desktop computers to go online. Meanwhile, the 55-years-and-older consumer segment is actually the fastest growing faction of mobile users, increasing its combined multi-platform and mobile-only share of audience from 60% to 74% in the past year.
- Because people prefer different devices depending on the online activity or task, the desktop vs. mobile skews by content category can vary widely. Categories such as Photos and Maps are more often than not used on the go, lending themselves to heavy mobile usage, while the Portals and Business/Finance categories comparatively index much higher on desktop devices. Although Portals function as an accessible hub of information on desktop, the mobile environment is markedly different where apps have taken on the role as the gateway to the web.
The full report can be found here.

