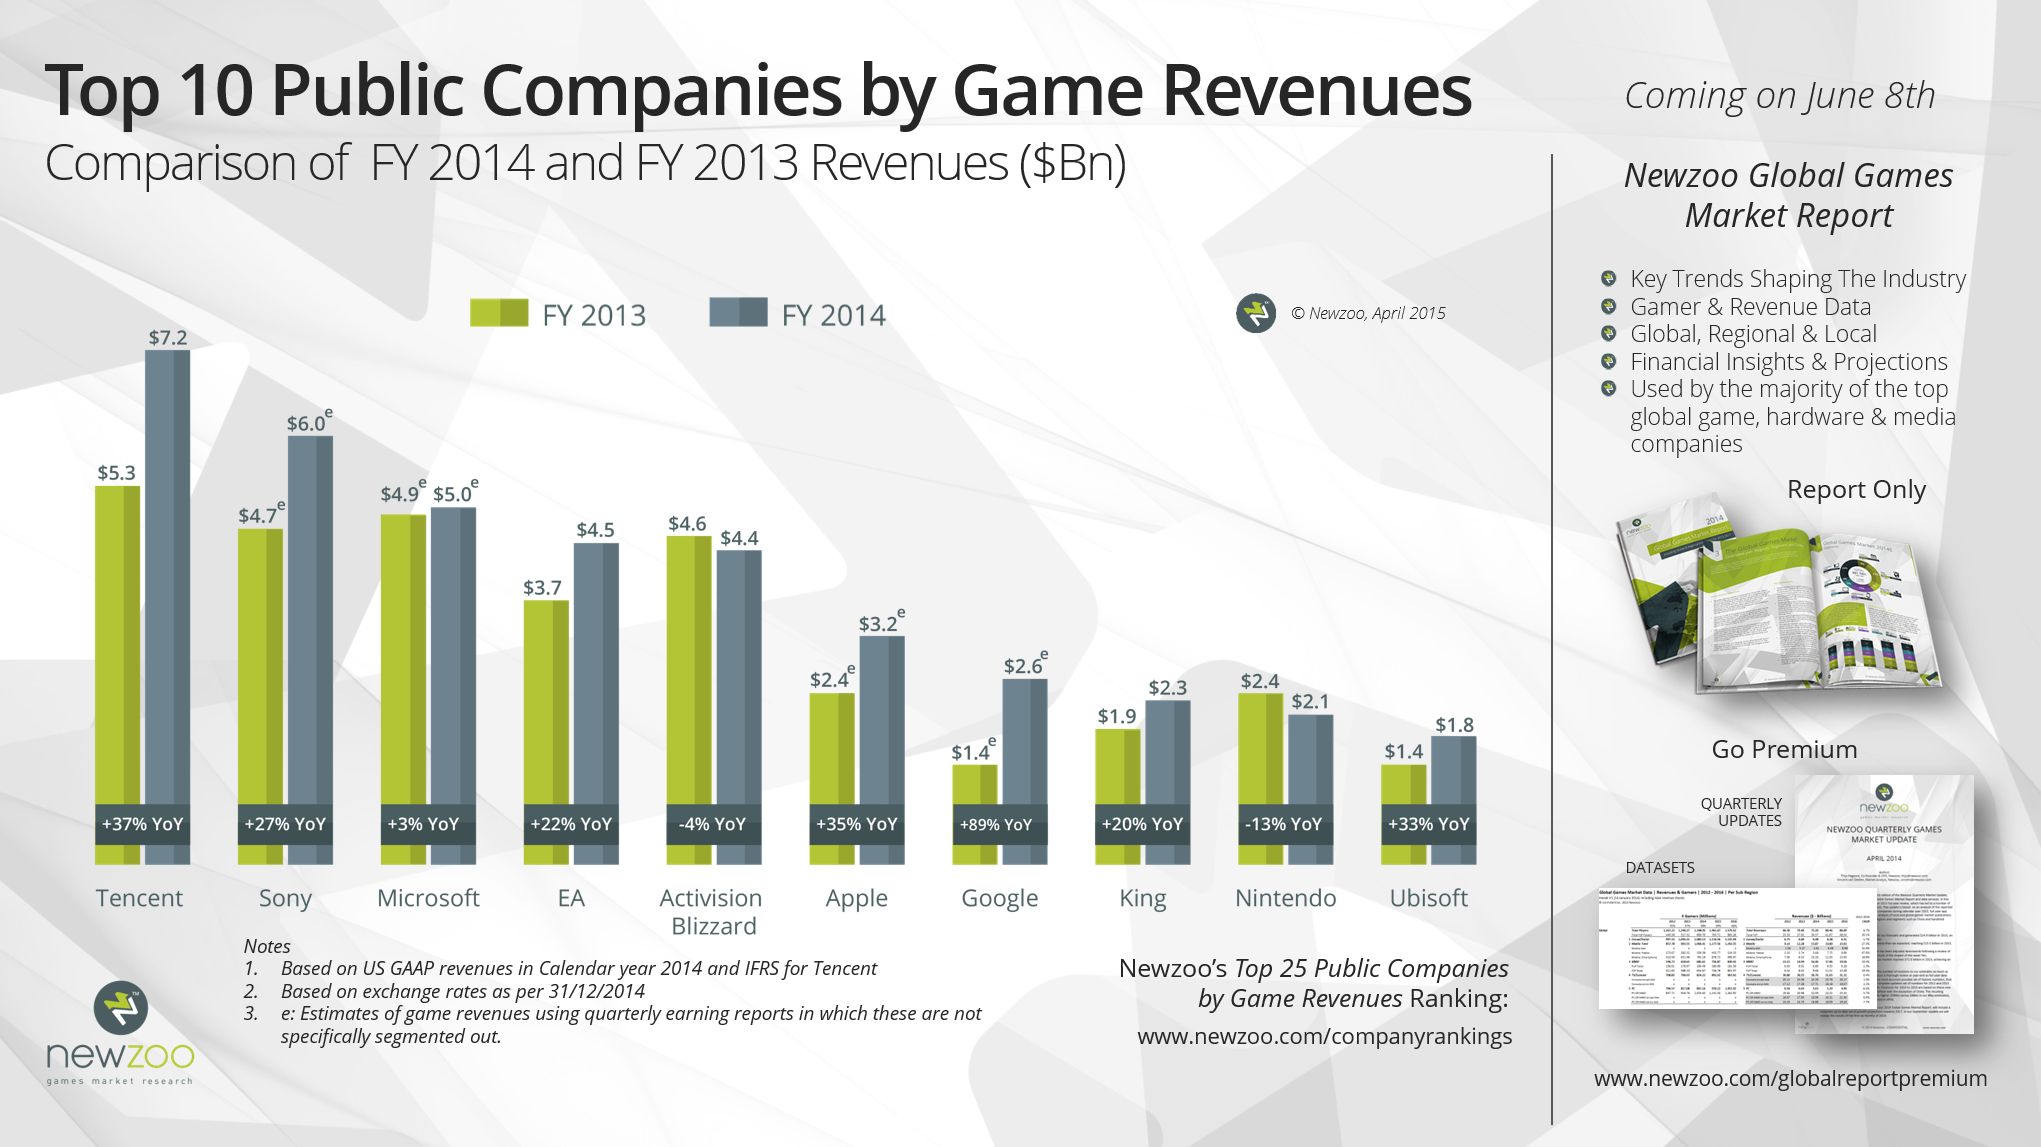
The top 25 public companies by game revenues generated $54.1 billion in 2014 and accounted for 65 perfect of the total $83.6 billion games market, according to Newzoo’s latest public company performance review. The 10 percent annual growth rate is indicative of a healthy and dynamic global games industry. The top performers in 2014 were Tencent, Sony, EA, Apple, Google and Ubisoft. Chinese internet giant Tencent remains the unchallenged leader following another year of excellent growth: +37 percent. SuperCell, the biggest private company by game revenues, would have ranked 11 in Newzoo’s ranking if it were a public company.
These findings are part of Newzoo’s latest quarterly update of its Global Games Market Report Premium service. An overview of quarterly and full-year revenues for the top 25 companies can be found in Newzoo’s free online ranking: Top 25 Companies by Game Revenues Ranking.
Will Japanese Companies Make a Comeback?
In 2013, Japanese companies accounted for 33.7 percent of all revenues generated by the top 25 companies. Last year this fell to 29.8 percent and the decline in absolute terms was -2.5 percent, despite Sony’s strong performance. Without Sony, the numbers would have looked much worse. Tellingly, nine out of the 16 publicly listed Japanese companies reported a year-on-year decline in revenues in 2014. The weak Yen obviously hurts the share of global revenues of Japanese companies when expressed in US$, but the Japanese industry also suffered from two fundamental weaknesses: being very exposed to the traditional console market with low growth and the three of Japan’s four mobile powerhouses Nintendo (-13 percent YoY), DeNA (-38 percent YoY) and GREE (-23 percent) being big in the “wrong” mobile sub-segments, notably feature phones and handhelds. Both issues are being addressed with a shift in focus towards iOS and regular Android games, but whether the partnership between Nintendo and troubled DeNA is the best route to global success on mobile remains to be seen.
Can Apple Hold Off Google’s Challenge in 2015?
At CES in January this year, Google announced that developers grossed over $10 billion in its GooglePlay store throughout 2014, the majority of which came from games. In 2014, no less than 83 percent of the global $24.5 billion mobile games market was generated through the app stores of Apple and Google combined. This remaining revenues are shared between third party Android stores, Amazon, the declining feature phone games business in Japan as well as mobile web games and direct downloads. With an estimated $2.6 billion in game revenues for 2014, Google is getting closer to Apple with $3.2 billion. However, Apple had a great year in China in 2014 as Newzoo recently reported, becoming the biggest tech brand in China by revenues with $37.1 billion of sales and an equally impressive $14.1 billion in profit. If the surge in hardware sales in China, which will soon be the worlds’ biggest mobile games market, converts to game spending, Apple will enjoy a strong boost in revenues and may pull away from Google again.
Do the Top 10 Company Movements Reflect Structural Changes?
Both EA and Ubisoft had very strong years reporting +22 percent and +33 percent growth rates respectively. EA took the prestigious fourth place from its biggest rival Activision Blizzard (-4 percent YoY) and Ubisoft entered the global top 10 by jumping up the ranks by an impressive four places. Where Ubisoft’s surge can be mainly attributed to several big releases in 2014, EA’s growth seems to be driven more by its continuous transformation and embracement of digital distribution, mobile platforms and monetizing games as a service. TakeTwo is the ultimate example of dependency on blockbuster launches as its 2014 revenues plummeted -60 percent following the release of GTAV the year before. Its recent launch of the PC version of GTA V and its commitment to give gamers the freedom they desire points to organizational change that could help remove the volatility in TakeTwo’s revenue streams.
The Impact of The Strong Dollar
With our company revenue analyses we use the year end exchange rates for the relevant period, so for the full year 2014 revenues this was December 31st, 2014. As a result, the growth of non-US companies in the top 25 may be lower than the growth figures in local currencies because of the strong dollar. For example, Ubisoft’s 2014 revenue growth in dollars would be more than 10 percent higher if the USD/EUR exchange rate remained unchanged since 2013. Most affected in 2014 were the Japanese companies, where for example GungHo Entertainment showed a 7 percent YoY decrease in US$, but a 6 percent increase in Yen.
Methodology
Our market analysis incorporates a detailed review of reported quarterly revenues of over 60 public companies around the world. Together, these companies generated more than $60 billion in revenues in 2014. The quarterly revenues and the geographical and segment revenue breakdowns of these companies provide a good insight into a large share of the global games market. The remainder of the market consists of revenues generated by the retail channel and private companies. We estimate that in 2014 physical retail revenues decreased and the private sector grew strongly in terms of revenues, mainly caused by the growth of the mobile segment. In Newzoo’s global games market model, the public company data is combined with primary research, census data for the top 130 countries in the world and a variety of other game, platform and revenue data sources.
Newzoo performs continued company analysis for a variety of its products including The Global Games Market Report and its Premium Quarterly Report service. The annual 2015 report will be launched in June.
[a]listdaily Analysis
by Steve Peterson
The main messages you see in Newzoo’s report on the top 25 publicly trade game companies is that both growth and change continue unabated in the game market. Most game companies showed at least some growth, and some showed exceptional growth. That’s reflected also in the wide global spread of the companies represented here, as well as the very different games, platforms, and monetization strategies employed by these companies. Clearly there are multiple ways to succeed in the game market these days.
It’s equally true that you can quickly get left behind in the game market, even if you’re still showing a little growth. There’s been plenty of change in the rankings of these top companies, so clearly the industry is not static. Big new releases, or a lack thereof, also clearly matters a great deal, as witnessed by TakeTwo’s decline in a year without Grand Theft Auto.
The outlook for the future continues to be one of more growth and more shifting in the ranks of publicly traded companies, as new strategies either succeed or fail. Hits continue to be of huge importance, but it’s also important to keep a successful game generating substantial revenue for a longer period of time.
It’s also important to remember that this list only covers publicly traded companies, and a good one-third of the overall revenue in the game industry comes from privately held companies. Some of those are quite substantial, like Valve, Supercell, and Machine Zone. While some private companies may become publicly traded in the next year or two, it’s equally likely that some new privately held companies may rise to prominence in that time, or a substantial hit may lift an existing company multiple ranks in one year.