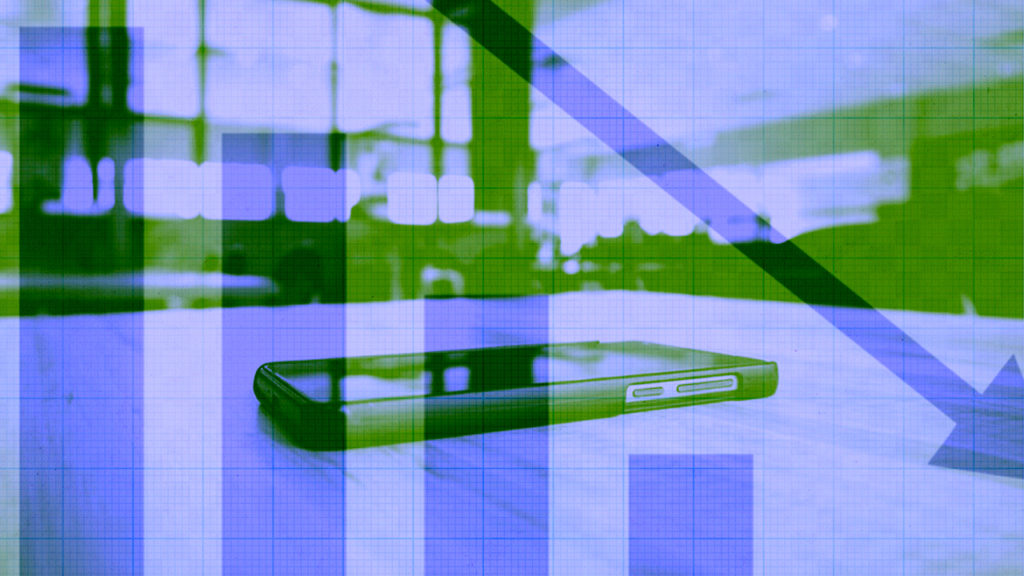
Ad spend declined by 31.6 percent across North America during the last two weeks of Q2 after increasing by 91.7 percent near the end of Q1, according to Socialbakers’ Q2 2020 social media trends report. The decease is likely a result of hundreds of brands pulling their Facebook ads in a show of support for a civil rights groups-led boycott against the platform.
Socialbakers’ findings show that worldwide ad spend bounced back, growing by 26.2 percent in Q2 compared to Q1. The period of April to May, when many businesses reopened, saw a dramatic increase in ad spend and cost-per-clicks (CPC). In the US, CPC increased by 31.1 percent and globally, by 55.3 percent. CPC in East Asia rebounded earlier than most regions, causing CPC to slightly decrease, from $0.158 to $0.148.
CPC for brand ad accounts, on the other hand, hit a low of $0.075 in April, but picked back up with a 42.7 percent increase to $0.107. Still, CPC were still 23.6 percent lower than they were in Q2 2019, at $0.140.
Overall, most industries returned to normal ad spend across regions in Q2, seeing an increase of an average of 27.1 percent. Looking to recoup losses suffered during the onset of the pandemic, the accommodation industry’s ad spend surged by 151.3 percent and ecommerce’s ad spend grew by 76.3 percent compared to Q1.
Despite signs that paid advertising was inching toward pre-pandemic levels, ad spend declined by 31.6 percent near the end of June, which could be linked to the anti-Facebook boycott.
Social media ad spend hasn’t shown signs of returning to normal. In fact, ad spend for the Facebook news feed dropped by 2.6 percent, part of an ongoing decline that started in January 2019—from a high of 64.1 percent of total spend to 57.7 percent in June 2020.
Among the top five platforms by relative ad spend, the Facebook news feed decreased by 34.6 in CPC and by 40.6 percent in cost per mille (CPM).
Facebook Instream Video, however, increased by 21.4 percent in CPC and 18.9 percent in CPM.
Spend on the Instagram feed also decreased, by 4.2 percent. Instagram feed and stories declined by about 37 percent in CPC and 28 percent in CPM.
In terms of organic social media, video content on Twitter and Facebook Live spiked in Q2.
Across platforms, Twitter had the highest percentage of video. Over the last three quarters, more than 20 percent of tweets from brand profiles with over 1,000 followers included a video. That figure rose to 27.3 percent in June.
Facebook Live represented just 0.99 percent of all posts from Facebook brand profiles, resulting in an increase of 26.9 percent in Q2. From March to June, Facebook Live increased by 126 percent, indicating its importance in the time of lockdowns.
The data also show increased activity around podcasts, with the number of brands on Instagram who mentioned podcasts growing from 510 in June 2019 to 1,087 in April 2020.
The pandemic has also impacted influencer marketing. In Q2, the number of influencers who used #ad in their posts decreased by 11.4 percent year-over-year.
These findings are based on Socialbakers’ analysis of a minimum of 50 Instagram profiles and 50 Facebook pages for any given category.