
This week, consumers expect a lot and want to see before they buy. Social media may love TV, but marketers are letting their Snapchat profiles grow dusty. Meanwhile, the tables have turned (ever so slightly) on how consumers watch live video.
Great Expectations
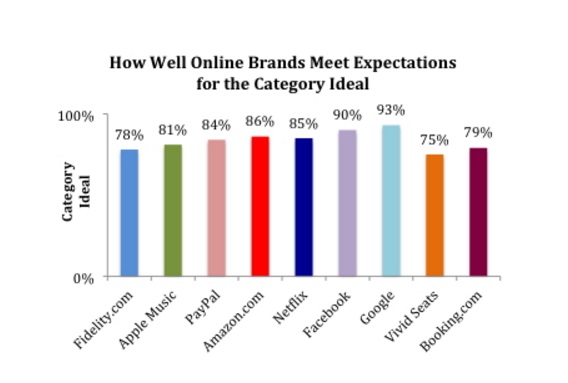
Modern consumers demand more from brands, which creates “an increasingly challenging environment for products and services seeking brand engagement,” according to the 22nd annual 2017 Customer Loyalty Engagement Index (CLEI), conducted by Brand Keys. Examining 740 brands across 83 categories, the study states that while consumer expectations have increased 23 percent over 2016, brands have only improved by 4 percent, leaving an enormous gap between what consumers want and what brands are seen able to deliver.
“’Brand engagement’ is a measure of how well a brand meets expectations consumers hold for the path-to-purchase drivers in a given category,” said Robert Passikoff, president of Brand Keys, in a statement. “Those drivers and expectations can be measured against a Category Ideal (100 percent) with brands best meeting consumers’ expectations generating greater loyalty and profits. Brands that cannot meet expectations lose customers and market share.”
For 2017, the top five sectors where expectations grew the most were:
- Online: Social Networking and Entertainment (+35 percent)
- Technology (+32 percent)
- B2B: Services and Equipment (+30 percent)
- Cosmetics (+28 percent)
- Personal Products & Consumer Packaged Goods (CPG) (+26 percent)
“Interestingly, there was only one category where expectations virtually stood still,” noted Passikoff. “Non-alcoholic beverages were up 9 percent, the lowest expectation growth in years. Perhaps that’s why selling soft drinks has become so problematic.”
Keeping It Social
According to Nielsen’s Social Media Report, adults spend an awful lot of time consuming media, particularly that of the social variety. Not surprisingly, millennials spend the most time on social media—six hours and 19 minutes weekly, or 24 percent of their total time spent on media overall. This figure is up 21 percent. It’s not just the “kids” that are doing it, either—share of media time spent on social media has jumped 64 percent among adults 50 years and up. They now spend 20 percent of their media time using social media.
Did you see that shocking scene in that one show you like? Of course you did, and chances are, you posted about it online. Nielsen reports were 14.2 million social media interactions about TV across Facebook and Twitter on an average day this fall in the US. On Twitter, 81 percent of the engagement with TV-related tweets come organically from audience tweets, while the remaining 19 percent come from owned content.
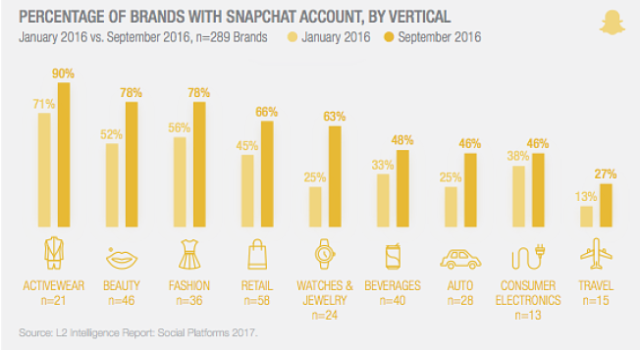
While brands are eager to reach young consumers with Snapchat, not a lot of them follow through, according to a new report by L2. Per the report, 62 brands opened up a Snapchat account between January and October of 2016, meaning that 64 percent of marketers have adopted the app. The watches and jewelry category grew the most, adding nine brands in nine months. Per L2, once a brand opens an account, it often goes unused. In January of 2016, 70 percent of brands’ accounts were active while only 67 percent were active in October.
Marketers and media agency professionals in China are eager to invest in social networking sites on mobile this year, according to AdMaster. Nearly 70 percent said they would prefer to invest in the medium, while 55 percent preferred to do the same on desktops and laptops. “More ad formats and marketing vehicles that are being made available to advertisers are relevant to younger generations,” said AdMaster COO Calvin Chan in the report. “This includes more in-feed ads on social media platforms like WeChat, QQ and Sina Weibo.”
Short video clips, in particular are becoming more popular in the region. “Though China doesn’t have a strong player like Snapchat yet, there’s an increasing number of apps like Meipai and Miaopai that encourage users to upload and share video clips that range in length from a few seconds to a few minutes.”
You’ve Got To Fight, For Your Right, To Live . . .
Live video isn’t just for news anymore, and a study by the UBS Evidence Lab found that millennials are the biggest consumers and creators of live video—63 percent have watched live content and 42 percent have created it. However, the number of people watching live video streams experienced a slight drop in just a few months’ time. Thirty-six percent of internet users said they watched live video as of November—two percentage points less than those who reported watching in a June survey by UBS.
In June, live video was consumed the most on YouTube, but Facebook Live won by a nose during a follow-up in November study, at 16 and 17 percent, respectively.
Visual Shopping
According to a report from DigitalBridge, there is an increasing “imagination gap” impacting purchasing decisions in the UK. The research found that in the last 12 months, a third of consumers delayed or decided against buying items when they couldn’t visualize how they would look like in real life. The majority of consumers revealed they would use a visualization tool if it was offered, and more than 55 percent believe it would make them more likely to make a purchase. That may all change, however, in a matter of years—Gartner believes that by 2020, 100 million consumers will shop in augmented reality.
Game On
Pokémon GO generated an estimated $950 million in revenues in 2016, according to a report by market researcher App Annie. The game brought in a staggering $800 million in consumer spend in 110 days (by the end of 2016, the game reached over $950 million). This was far faster than some of the most successful mobile games of all time. To put Pokémon GO‘s success in a broader perspective, its global consumer spend in 2016 exceeded the total worldwide box office gross of Batman v Superman: Dawn of Justice.
Video game industry sales saw a decline across the board in December, dropping 15 percent to $2.8 billion. Individually, however, Microsoft enjoyed a year-on-year, 10 percent increase in the number of Xbox One systems sold during December. PlayStation 4 was the top-selling hardware system in the month and the PlayStation 4 Slim System 500GB Uncharted 4: A Thief’s End Bundle was the month’s top seller.
The NPD’s top 10 best-selling games for December 2016 are:
- Call of Duty: Infinite Warfare
- Final Fantasy XV
- Battlefield 1
- Madden NFL 17
- NBA 2K17
- Watch Dogs 2
- Grand Theft Auto V
- Pokémon Sun*
- FIFA 17
- Pokémon Moon*
*Asterisks indicate that digital sales were not accounted for.