NPD September 2015: Low Hardware Sales Lifted By Sports Games

With the upcoming holiday seasons marking the second year of the current video game console generation (3rd for Nintendo), companies like Sony, Microsoft and Nintendo are struggling more than ever to attract buyers. If September is any indication,the fall might be a slow for hardware adoption, but those numbers may be buoyed by strong software sales.

The NPD September 2015 Report (via VentureBeat) shows that hardware sales, which are primarily focused on PlayStation 4 and Xbox One, took a slight drop-off, while sports-related games continue to thrive and may continue to sell throughout the holiday shopping season.

Numbers provided by The NPD Group indicate that consumers spent $1.01 billion on new games and hardware in the U.S., which is a 9% decrease from the previous year. While overall numbers are down, games that require special figurines, like Disney Infinity 3.0 and Skylanders Superchargers, fared very well.

The NPD Group also reported that hardware sales were down 27%, dropping to $313.5 million from the previous $431.2 million total. Game sales also dipped a bit, dropping from $480.6 million in the previous year to $465.6 million (a $15 million difference). However, keep in mind that Activision’s Destiny, which released around the same time last year, generated a big interest in upgrading consoles.

Even though these numbers sound like negative, the Group indicates that month-over-month statistics are still positive. The majority of hardware platforms increased their sales from August 2015 to September 2015 when comparing sales on a per week basis, said NPD analyst Liam Callahan. All eighth generation consoles [which includes PS4, Xbox One, and Wii U] experienced double-digit growth when comparing sales on a per-week basis.

Top sellers for September include 2K Sports’ NBA 2K16 and EA Sports’ Madden NFL 16, which both topped the list, with FIFA 16 in fourth place and NHL 16 coming in ninth. Four out of ten most popular games are sports titles, and they should continue selling well over the next few months.

Action games also did very well. Konami’s Metal Gear Solid V: The Phantom Pain came in third, followed by the new Destiny expansion The Taken King in fifth. Disney Infinity 3.0 and Mad Max came in seventh and eighth, respectively.

While most of the list was dominated by Xbox and PlayStation titles, Nintendo made an impression with Super Mario Maker, coming in sixth with well over a million copies sold. It is still one of the company’s biggest offerings for the holiday season.

Finally, Minecraft continues to be a big win for Microsoft, coming in tenth. Although the game has been around for quite some time, the Windows 10 Edition appears to have renewed interest in it.

The sales of games and consoles should pick up over the next few months, especially with heavy hitters like Star Wars: Battlefront and Halo 5: Guardians arriving at retail. Accessory-based games should also be big hits, including interactive toy games like Lego Dimensions along with the newly released music and rhythm games Guitar Hero Live and Rock Band 4.

Facebook Gets Top Grades For Ad Effectiveness

With the popularity of social networks like Twitter and Facebook, it should be no surprise that advertisers are getting their money’s worth out of their investments. A new report from eMarketer, titled “Social Advertising Effectiveness Scorecard: Industry Execs Grade the Leading Platforms”, gave these marketers an opportunity to rate the best sites out there to see which made the biggest impact.

Chart 1020

The chart shows all the ratings, with Facebook faring the best out of the “big three” with a B+ rating, followed by Twitter with a B- and Linkedin with a C+. Meanwhile, out of the three emerging social networks, Pinterest fared the best with a B, followed by Instagram with a C+ and Snapchat with a C-.

“The executives we interviewed said one of the key strengths of paid social media advertising is its targeting capabilities,” said eMarketer principal analyst Debra Aho Williamson. “Marketers consider Facebook an extremely sophisticated targeted advertising platform, while Pinterest benefits from its strong connections with ecommerce and purchase intent.”

These results were measured across a number of categories, including creative capabilities, ad targeting, measurement and ROI, according to eMarketer. In general, paid social media advertising fared around an average grade of B. It’s sufficient, but there’s need for improvement with better tools to make social media advertising even more effective.

As for ad targeting effectiveness, Facebook fared the best, with an A rating, according to the chart above. Linkedin and Twitter tied for second with a B rating when it came to the “big three.” As for up-and-coming networks, Instagram got the highest rating with a B, followed by Pinterest (C+) and Snapchat (C-).

Chart 1020 2

Other highlights from the eMarketer report are as follows:

  • LinkedIn’s highest grade came for ad targeting, for which it earned a B; advertisers gave it grades ranging from B- to C in other categories.
  • Twitter performed strongly in creative, ad targeting, measurement and analytics, building brand awareness, engagement and driving actions, all of which earned a B. It scored slightly lower for driving sales and for ROI.
  • Among the “Emerging Three” social ad properties (Instagram, Pinterest and Snapchat), Instagram received high grades in creative and building brand awareness and engagement. However, the newness of its ad platform led to lower grades for things like measurement, driving actions and ROI.
  • Executives gave B grades to Pinterest in the majority of categories; only measurement and ad targeting fell into the C range.
  • Snapchat had strong marks for creative capabilities and building brand awareness, but the newness of its ad platform led to grades for the rest of the categories that were among the lowest of the properties studied.

eMarketer also noted that the video ad category played a part in the report. Executives gave an average rating of B+ to both Facebook and YouTube in this regard, based mainly on effectiveness. Twitter also got a decent grade with B-, though some execs questioned if it’s the best format to watch video on.

The full report can be found here, though a corporate subscription to eMarketer is required.

Image source

Brands Are Flocking To Instagram This Year

Now that 88.2% of U.S. companies overall use some form of social media platform for advertising, it’s safe to say that the model is a success. Instagram is a huge part of that success, and it is seeing a big boost from its ad programs. As a result, more companies could be hopping on board.

According to a recent eMarketer report, 32.3% of U.S. companies with 100 employees or more will begin using Instagram in some form or another for marketing. That’s an estimate for the end of this year, and it’ll go even further over 2016 and 2017. By next year, the number will increase to 48.8%, and up to 70.7% once 2017 rolls around. That will give Instagram a further edge in surpassing Twitter.

“Now that Instagram is opening up advertising to all businesses, it’s not surprising that marketer usage will grow rapidly,” said eMarketer principal analyst Debra Aho Williamson. “Its close ties to Facebook are a key advantage.”

Chart 1020 3

While Twitter will still continue to see growth when it comes to U.S. companies using the site for marketing, it will have a much lower penetration, by about 1.4% over the next couple of years. The chart below breaks down just how low its effectiveness is compared to the thriving Instagram.

Meanwhile, Facebook will continue to see success within the social arena. By the end of this year, 84.7% of U.S. companies (with 100 employees or more) will be using the site for marketing, and it will see a slight increase over the next couple of years, getting to 85.8% in 2017. That’s not necessarily bad news, since its numbers are still higher than Twitter, and a little ahead Instagram, which Facebook owns.

It just goes to show that Instagram’s advertising model is incredibly effective, and will continue to thrive as the next couple of years go on. Facebook will continue to succeed right alongside it. Meanwhile, Twitter may need to figure out a way to make its advertising more relevant.

Image Source

Do The Not-Wrong Thing

Simple can be harder than complex: You have to work hard to get your thinking clean to make it simple.

– Steve Jobs


You don t always have to do the right thing.

As humans, we instinctively know what s wrong. We can see a picture on the wall and know instantly that it’s not level, find a misspelling in a sea of words, and recognize a strategic business move that’s going to burst into flames. These mistakes stick out like a flashing neon sign.

Although we may not have a clue what the right thing to do is, we do know pretty quickly when it’s wrong.

Therefore, as long as we don’t pick the wrong thing, we’d at least be taking a step in the right direction.

Don’t Do The Wrong Thing

While most complex problems can have simple solutions, often those solutions aren’t a one-and-done thing. Unlike a patch in software, sometimes solutions are multi-layered and have many parts.

When I’m faced with complex problems, I brainstorm and lay out all the possible solutions. From simple to multiple-layer solutions, I chart the path of each one so I can test them. What I’m looking for are the solutions that feel wrong. From short-cutting, reducing quality, or short-term thinking, I can see a wrong move a mile away. I don’t need to know what the overall right move is, I just need to trust my instincts and choose what doesn’t feel wrong.

I know that if I choose wisely for each layer of the solution, I’ll eventually end up doing the right thing. Let’s call this the Eventually-Right Process.

The Eventually-Right Leader

This process can be used in everyday business management strategy. The beautiful thing is, it always works. By not doing what s wrong, you can t really go wrong.

As business leaders, we are always under constant pressure to come up with the right solutions. Whether time-sensitive or not, using the Eventually-Right Process gives you the piece of mind that you are on the right path and, ultimately, you will come to the right solution.

For example, I need to hire someone new. I have three candidates: A, B and C. I could just go ahead and hire Candidate A and hope for the best. Or I could use the Eventually-Right Process. It might go like this:

  • Something about Candidate C feels ‘off’, so if I eliminate C.
  • I schedule a second round of interviews with Candidate A and B. Maybe I interview them at the same time to provoke new responses. Either way, I get another chance to find whether Candidate A or B feel wrong.
  • Candidate B does, so I hire A.

Eventually, by eliminating each path that felt wrong, I arrived at the right solution.

Choosing the Not-Wrong Path

I dare you to try the Eventually-Right Process in your next decision, business or otherwise. It may feel deceptively simple not to mention, a little uncertain , however as you see the ROI from you decision-making roll in, I think you’ll understand the value. You’ll begin to feel better about the decisions and make them easier. Good decisions can greatly improve the quality of work and life.

Just remember: the art of doing the right thing is not choosing what’s wrong even if you don t know what s right yet.

You will eventually.

Native And Programmatic Advertising Set To Merge

Both native and programmatic advertising tools have been beneficial to marketers and companies alike over the past few years, but what would happen if the two merged into one natural ecosystem We’re about to find out.

According to a report from the Business Insider, a new specification from the Interactive Advertising Bureau (IAB for short) under the name OpenRTB 2.3 makes this possible.

With it, the company hopes to provide the “ability to serve up sponsored content that matches the look and feel of a publisher site in real time through automated processes.”

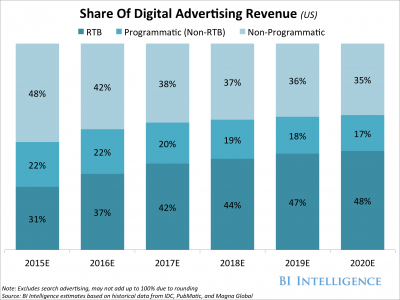
Additional research from BI Intelligence indicates that this has been coming for some time, with programmatic advertising reaching a “tipping point.” Its stats indicate that programmatic transactions will reach a majority percentage of 52% in non-search digital-ad spend, along with 30.6% of total digital ad-spend going to programmatic real-time bidding, or RTB for short. Meanwhile, 21.7% will go to non-RTB programmatic

Chart

As you can see from the chart, the differences between RTB, programmatic and non-programmatic bids are set to go through some changes over the next few years, with a decrease in RTB and a rise in non-programmatic means. So, a fusion between native and programmatic could be likelier than expected.

There are some takeaways from the report, including the following:

  • More companies and marketers are picking up on programmatic ad-buying and selling programs. Over 80% of agencies and brands already purchase display ads programmatically, while an even greater proportion of publishers are pursuing programmatic channels as part of their sales strategies, according to surveys and our own conversations with industry participants, according to Business Insider’s report.
  • Spending on programmatic advertising is growing very fast, at around 20 percent at an annual rate.
  • Real-time bidding has become rampant with companies through programmatic means, with a five year CAGR estimated at 24 percent. RTB revenue will top over $26 billion by year-end 2020, up from $8.7 billion this year. Mobile RTB and video RTB are growing even faster, at roughly 2X the rate of programmatic overall.
  • “Trading desks” are being downsized in favor of programmatic expertise taking over in the natural ecosystem. This may speed growth in programmatic spending among agency clients.
  • Here’s how pricing is breaking down: for premium and guaranteed placements they are on the upswing, while prices continue to plummet for miscellaneous inventory.

The big conclusion from this report indicates that this could open a few doors as far as advertising circles are concerned, even though some companies would have to get used to certain results and methods. This fusion of two different advertising types could introduce some great new ideas for consumers.

Image source

Why Snapchat Is A Hot Commodity For Marketers

Some companies have been hesitant to adopt the Snapchat app, mainly due to how the content is only posted temporarily and, more importantly, the high advertising price. However, that didn’t stop [a]listdaily from advising companies to why they should hop on the bandwagon. Now, there are even more reasons to do so.

A recent AdWeek article reveals six different statistics from the popular app that show why companies should hop get involved with it now more than ever. The company’s CEO, Evan Spiegel, was quick to point out that over 16 million viewers check out the new ad-supported Sponsored Selfie Filters program a day. That makes the fee charged for ads, which can be as high as $700,000, worth it when it comes to exposure. Traditional magazine-turned-digital-juggernaut Cosmopolitan, which is one of the handpicked publishers on the app, sees three million viewers a day through Snapchat Discover, according to Digiday. 

iHeartRadio has managed to amass a huge streaming audience on Snapchat, with over 340 million impressions during its two-day music festival back in September. That’s big numbers, especially for a digital music brand like that.

Facebook should also be sweating the details from Snapchat’s popularity. A report from Piper Jaffray indicates that the app is way more popular with American teens than the social site, with 19% indicating that the mobile app is their most used social network. Instagram continues to have a steady lead with 33%, followed by Twitter (20%) and then Facebook right behind Snapchat with 15%.

Finally, the biggest stat of them all: an International Business Times report indicates that Snapchat gets an overall total of four billion video views a day. That matches the same number as Facebook’s recent video service numbers, up from three billion earlier this year.

Snapchat also played a big part at the MTV Video Music Awards. Between red-carpet coverage, backstage performances by Macklemore and Pharrell Williams, and crowd perspectives during Kanye West’s address, Snapchat managed to get twelve million viewers to tune in. That’s twice the number of those watching it on television, according to Fast Company.“With Snapchat, we’re putting our content into the pockets of 100 million millennials,” said Viacom sales chief Jeff Lucas regarding the numbers. “Snapchat is targeted television on mobile.”

The current value of Snapchat sits at $16 billion, but it operates a bit differently than most social networks. “We have two major businesses,” said Snapchat chief strategy officer Imran Khan. “One is communication, and the other is entertainment.” And they both play a part into the app’s success.

With a demographic between the ages of 13 and 34 that makes up a whopping 86% of its overall audience, Snapchat is becoming a force to be reckoned with if brands want to reach a younger demographic.

App Engagement Decreases Soon After Install

While there are more than enough mobile apps to go, the frequency in which they’re used isn’t as frequent as most companies hope, according to a new report from Millward Brown Digital.

First reported by eMarketer, a study conducted back in August indicates that there’s a serious lack of engagement with smartphone apps. Interest usually dips after the first 24 hours of install. The survey shows that 43% of smartphone owners in the U.S. use four to six apps on an average day. Considering they have between 40 to 70 installed per device, that’s a pretty small count.

Chart 2

The study also shows that 72% of smartphone owners delete an apps due to lack of use. Other reasons for removal include an app’s battery drain, or freeing up memory space.

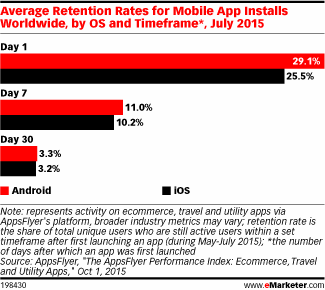
Another study, conducted by Appsflyer in July 2015, took a closer look at engagement, and how useful it is for app marketers. Looking over 450 million installs across all of eCommerce, the report indicates that engagement drops for both iOS and Android devices after that 24 hour period, with only 3.3% of Android users and 3.2% of iOS users using an app afterward.

Organic app acquisition plays a big part, according to the Appsflyer’s report. Retention rates on Android devices after a month’s time (30 days) shows 156% greater for organic app installs than paid app installs. The chart below breaks it down even further, for both Android and iOS. As you can see, there’s quite a drop off over a period of time – which could be alarming news for marketers that rely on app success.

Now it’s just a matter of finding a solution to this problem by looking into apps that keep people around on the long-term. Social sharing applications, like Facebook and Snapchat, keep people coming back for more with a daily, even hourly, interactions. Free-to-play games like Candy Crush Soda Saga and Clash of Clans also have a high popularity rate, making big money for its producers as a result.

Will marketers find a way to keep their apps relevant It’s just a matter of time, but it never hurts to study the successes.

What You Need To Know About Big Data

Put plainly, big data is a term that describes huge data sets produced from a variety of digital sources like social media. It’s comprised of structured, semi-structured, and unstructured data that cannot be handled by conventional databases or software. Instead, all of it is sent through specific analytical programs to make sense of it all and make predictions.

ABI Research believes that big data spending will reach $114 billion globally in 2018. An estimate that was echoed earlier this year in a Duke University report, reported on by Adweek, which indicates that marketing data budgets will double, while mobile ad spending will triple over the next three years.

Big data is big business, and here are 8 key stats to keep in mind:

  • Mobile advertising currently takes up 3.2% of marketing budgets, and is likely to almost triple to 9% over the next three years, according to the Duke University report.
  • The report also indicates that traditional advertising budgets are expected to fall 1.1% by early 2016.
  • Social media advertising currently makes up 9.9% of spending, and a jump to 22.4% is predicted over the next five years.
  • Marketing budgets are expected to rise by 8.7% in 2016, which will make it the biggest growth since 2012.
  • A Q1 2013 survey from CMO Council and SAS found that 6 out of 10 marketers see big data as both an obstacle and opportunity (reported by eMarketer).
  • That same report reveals that 15% believe it is full of opportunity, and that they had all the tools they needed.
  • A KPMG survey, also reported by eMarketer, found that 2 out of 5 managers believe that buy-in was important, but only 25% of them were putting big data related insights into practice.

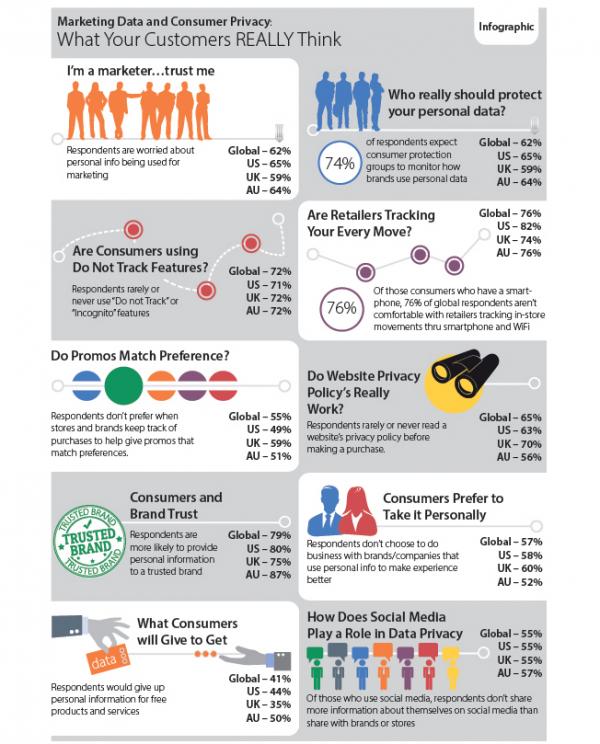
The biggest obstacle in dealing with big data is that everyone agrees that it’s powerful, but at the same time, can be overwhelming. Furthermore, customers are becoming increasingly wary of privacy concerns. A 2014 study from the content analytics firm SDL (via Adweek) showed that almost two-thirds of customers in the U.S. and around the world worry about marketers using their personal information. A fear that surely contributed to how the E.U. court ended Safe Harbor earlier this month, a compact that had streamlined data flow across 4,000 companies including technology firms and ecommerce.

The chart below, published by SDL, shows that 65 percent of respondents in the U.S. (62% globally) worry about their personal information being used in marketing. Yet, 71% (72% globally) rarely or never use “Do not Track” or “Incognitio” features on their devices. Furthermore, 58% of U.S. respondents (57% globally) said that they wouldn’t do business with brands or companies that want to use personal information for a better experience.

Trust Marketers 01 2014

However, a little trust goes a long way. 80 percent said that they’d be willing to share information with trusted brands, so long as they’re transparent about how they collect data, what’s it’s used for, and what they get out of it.

Image Source

Top 100 Countries Ranked By 2015 Game Revenues Revealed

This year, Newzoo s Top 100 Countries By Game Revenues, the comprehensive overview of the global market, represent 99.7% of the $91.5 billion games wallet worldwide. This overview, taken from our 2015 Global Games Market Report shows that top 20 countries alone will generate an estimated $83.0 billion this year, or 90.8% of total global games revenues. The ranking shows China at number one with 2015 revenues estimated to reach $22.2 billion, eclipsing the US for the first time as the world s top games market. El Salvador takes position 100 with $11.5 million in annual revenue.

Asia Pacific Contributes Almost Half of Top 100 Revenues

In 2015, countries from the Asia Pacific region account for 47.2% of top 100 revenues, with China leading the way. Despite mobile gaming growing faster than PC gaming in China, the market is still dominated by the Computer Screen, which will generate $15.2 billion this year, or 68% of total Chinese revenues. Southeast Asia is growing faster than anywhere else, driven mainly by mobile gaming, the region s largest segment in 2015. Thailand remains Southeast Asia s biggest earner. Thai revenues will reach $338 million in 2015, up +42.2 from the previous year, making Thailand the 23rd largest games market in the world. Hot on Thailand s trail, Indonesia will gain six ranks this year to take position 24 and generate $313 million in revenues, an astounding increase of +52% on 2014. With explosive growth rates like these, it wouldn t be too surprising to see a Southeast Asian country break into the top 20 in 2016.

India Soars into the Top 20

The most notable climber in the top 20 is India, gaining five ranks this year to be the 18th largest games market in the world. Indian consumer spending is growing rapidly. In 2015, India will have 159 million gamers who will generate revenues of $428 million, up +62.0% from 2014. By 2018, the Indian games market, driven primarily by the mobile segment, will break the billion dollar mark, representing an impressive compound annual growth rate (CAGR) of +49.2% for 2014-2018. This makes India one of the fastest growing games markets in the world and on its way to being a major global player. Increasingly, international companies are turning their focus to India, especially following recent news that Apple and Google have lowered the minimum price for apps and in-app purchases there. Stay tuned for our upcoming report, The Indian Games Market Review, for more insights into this dynamic and rapidly growing region.

Countries Overtaking Western European Nations

The overall Western European games market will reach $15.6 billion this year. While this represents a steady year-on-year increase of 1.9%, individual countries are losing their positions in the top 100 to faster growing regions of Southeast Asia, Latin America and Middle East and Africa. Notably, the Netherlands will lose two spots, while Belgium and Norway will lose five positions each. Mexico will gain one place to be the 13th largest games market in 2015, while further down the ranking, Argentina and Colombia will also see slight gains. Brazil remains, Latin America s leader at $1.5 billion. In Middle East and Africa, Turkey, Saudi Arabia and Iran will also climb the ladder and overtake Western European countries in the process. Meanwhile, Germany will maintain its spot as the largest Western European games market and generate $3.7 billion, with TV/Console gaming taking the biggest share of the market.

Image Source

Ad Blocking: Adding Up The Numbers

[a]listdaily reported earlier in the year about the rise in ad blocking services, and how they are concern to marketers and companies alike. The issue continues to grow, as new numbers indicate that ad blocker usage is growing faster than ever among Internet users, even on mobile.

Now the IAB has changed their tune about ad blocking. “We messed up,” said Scott Cunningham, senior vp of technology and ad operations at the IAB. “Looking back now, our scraping of dimes may have cost us dollars in consumer loyalty.” He goes on to say how not focusing on the user has directly impacted the rise of ad blocking. “The fast, scalable systems of targeting users with ever-heftier advertisements have slowed down the public Internet and drained more than a few batteries. We were so clever and so good at it that we over-engineered the capabilities of the plumbing laid down by, well, ourselves. This steamrolled the users, depleted their devices, and tried their patience.”

PageFair recently posted a series of startling numbers, in partnership with Adobe, that show just how much ad blocking is being used these days. The full report can be found here, but here’s the quick rundown.

  • Ad blocking is set to cost publishers nearly $22 billion for this year alone.
  • There are now almost 200 million active ad blocking users around the world. Right now, it sits just at 198 million.
  • Ad blocking has grown over 41% around the world over the last year.
  • U.S. ad blocking grew 48% in the last 12 months, leading up to June 2015. The total number of active users is 45 million.
  • U.K. ad blocking grew even higher, by 82%, to 12 million active users for the same time period.

Chart

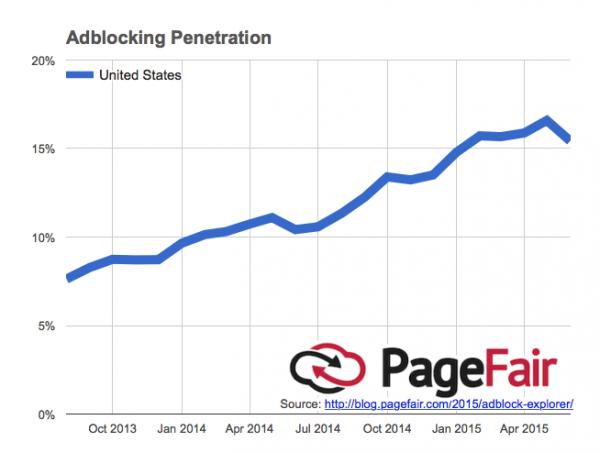
The chart breaks down just how much ad blocking has grown in the U.S. alone, going higher in penetration over the past two years by nearly double the count.

This is a cause of concern for many companies, including many of the bigger ones working their way around the market. As noted by AdWeek, YouTube has been fiddling with an ad-free subscription service to counter the many users that have been utilizing ad blocking software.

But Zack Sinclair, CEO of FairBlocker, states that YouTube is its own problem in that regard. “A lot of people blame YouTube for ad block usage,” he said. “Display ads are easy to ignore. On YouTube, you see exactly how much time is being wasted.”

Adblock Plus, AdGuard and uBlock have thrived as a result of users wanting to block these ads, although it’s leaving quite a dent in big business. Especially considering that digital video advertising has increased by almost 60% for this past year. But with almost 150 million people having some form of ad-blocking software, companies are scrambling for solutions.

Not everyone thinks that YouTube’s proposed subscription plan is a good idea, particularly Frederic Montagnon, CEO of Secret Media. “What I don’t understand, actually, is that today, for someone using ad blocking, they don’t see any ads, so they won’t see any reason to pay YouTube – or anyone – to prevent being exposed to them,” he explained.

A report from Montagnon’s company indicates that only two percent of Internet users would be willing to pay for the subscription plan to access online services, which is far from encouraging.

There is some question in terms of users blocking such ads and possibly doing harm to companies, but that isn’t stopping them from subscribing, according ad block user Ian Evans, who explains the benefits in a recent blog post. “I first began using AdBlock primarily because of YouTube,” he explained. “Before every movie trailer, every music video, every episode of Crash Course and every 90-second cat video, I had to watch a minute-long advertisement. Sometimes I could click past it after 30 seconds, but increasingly, I couldn’t. Sometimes it was longer than the video itself.”

Even Apple is taking preventive measures, recently blocking the iOS ad blocking app Been Choice from sale on the App Store, according to Business Insider. The app’s co-founder, Dave Yoon, believes it could return, but ad blocking may have put the company into a “conundrum” in terms of user privacy and the customer’s choice to use such an app.

Apple’s statement the matter is, “Apple is deeply committed to protecting customer privacy and security. We’ve removed a few apps from the App Store that install root certificates which enable the monitoring of customer network data that can in turn be used to compromise SSL/TLS security solutions. We are working closely with these developers to quickly get their apps back on the App Store, while ensuring customer privacy and security is not at risk.”

However, the question of whether they can still effectively be used for ad blocking has yet to be seen.

“They can’t let us in if we block in-app ads and iAds, could they ” Yoon asks. “We obviously don’t win by putting the biggest and arguably the best-loved company in the world in a conundrum. So we need to work with them.”

“We need to get back to the App Store without this stopping us since we’re trying to be more than an ad blocker.”

Image source